Safety Digital Box (SDB)
Swiss Cheese Model Analysis
Multi-Scenario Crossing Failure Mitigation
A defense-in-depth analysis applying Reason's Swiss Cheese Model to the Safety Digital Box at highway–rail grade crossings. This document presents a quantified defense penetration model, evaluates double-train and single-train scenarios, and assesses SDB efficacy for cyclists, pedestrians, and signalized crosswalk configurations. Prepared for FRA/CPUC/SSO technical review.
Safety Digital Box (SDB) is an advanced grade crossing safety technology that provides proactive, intelligent alert systems designed to prevent accidents and save lives. By delivering real-time, context-sensitive information to road users through progressive visual displays, SDB addresses the behavioral failure modes that traditional warning infrastructure alone cannot resolve.
With over 3,620 crossing incidents documented between 2014–2024 and a 134% increase since 2014, SDB targets the critical gap between existing infrastructure and human behavioral response — particularly during multi-train events, signalized preemption failures, and vulnerable user scenarios.
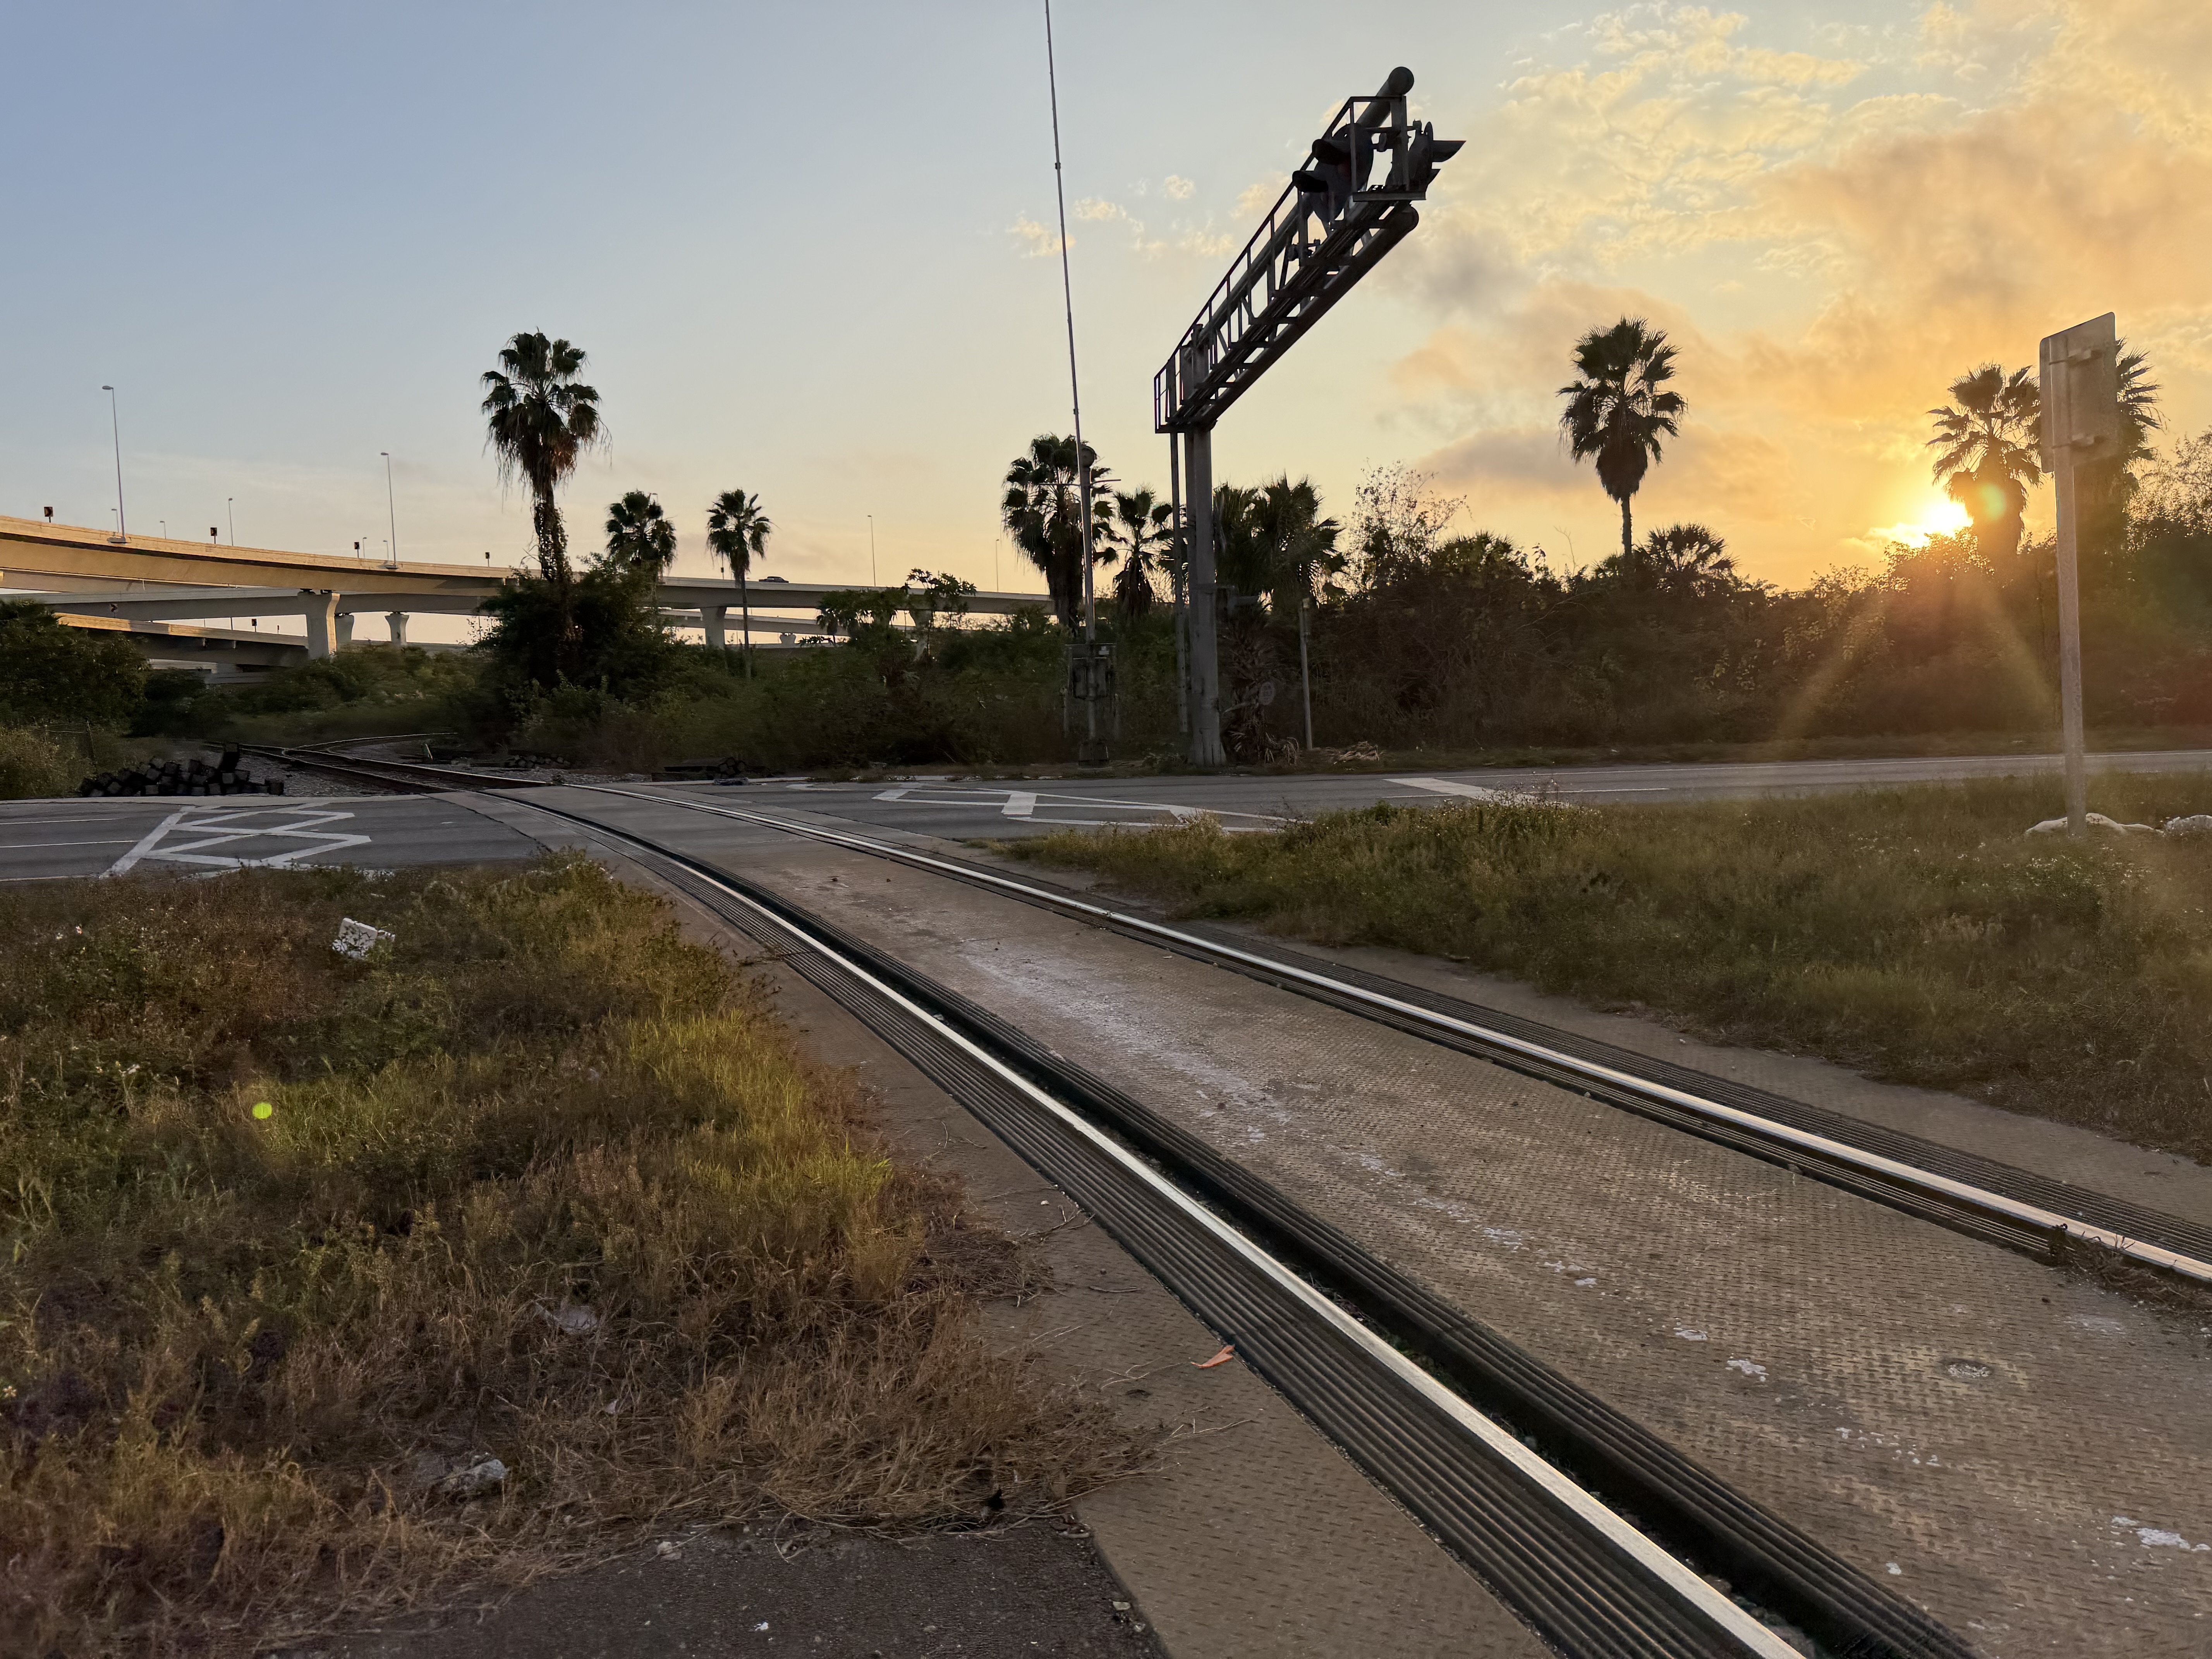
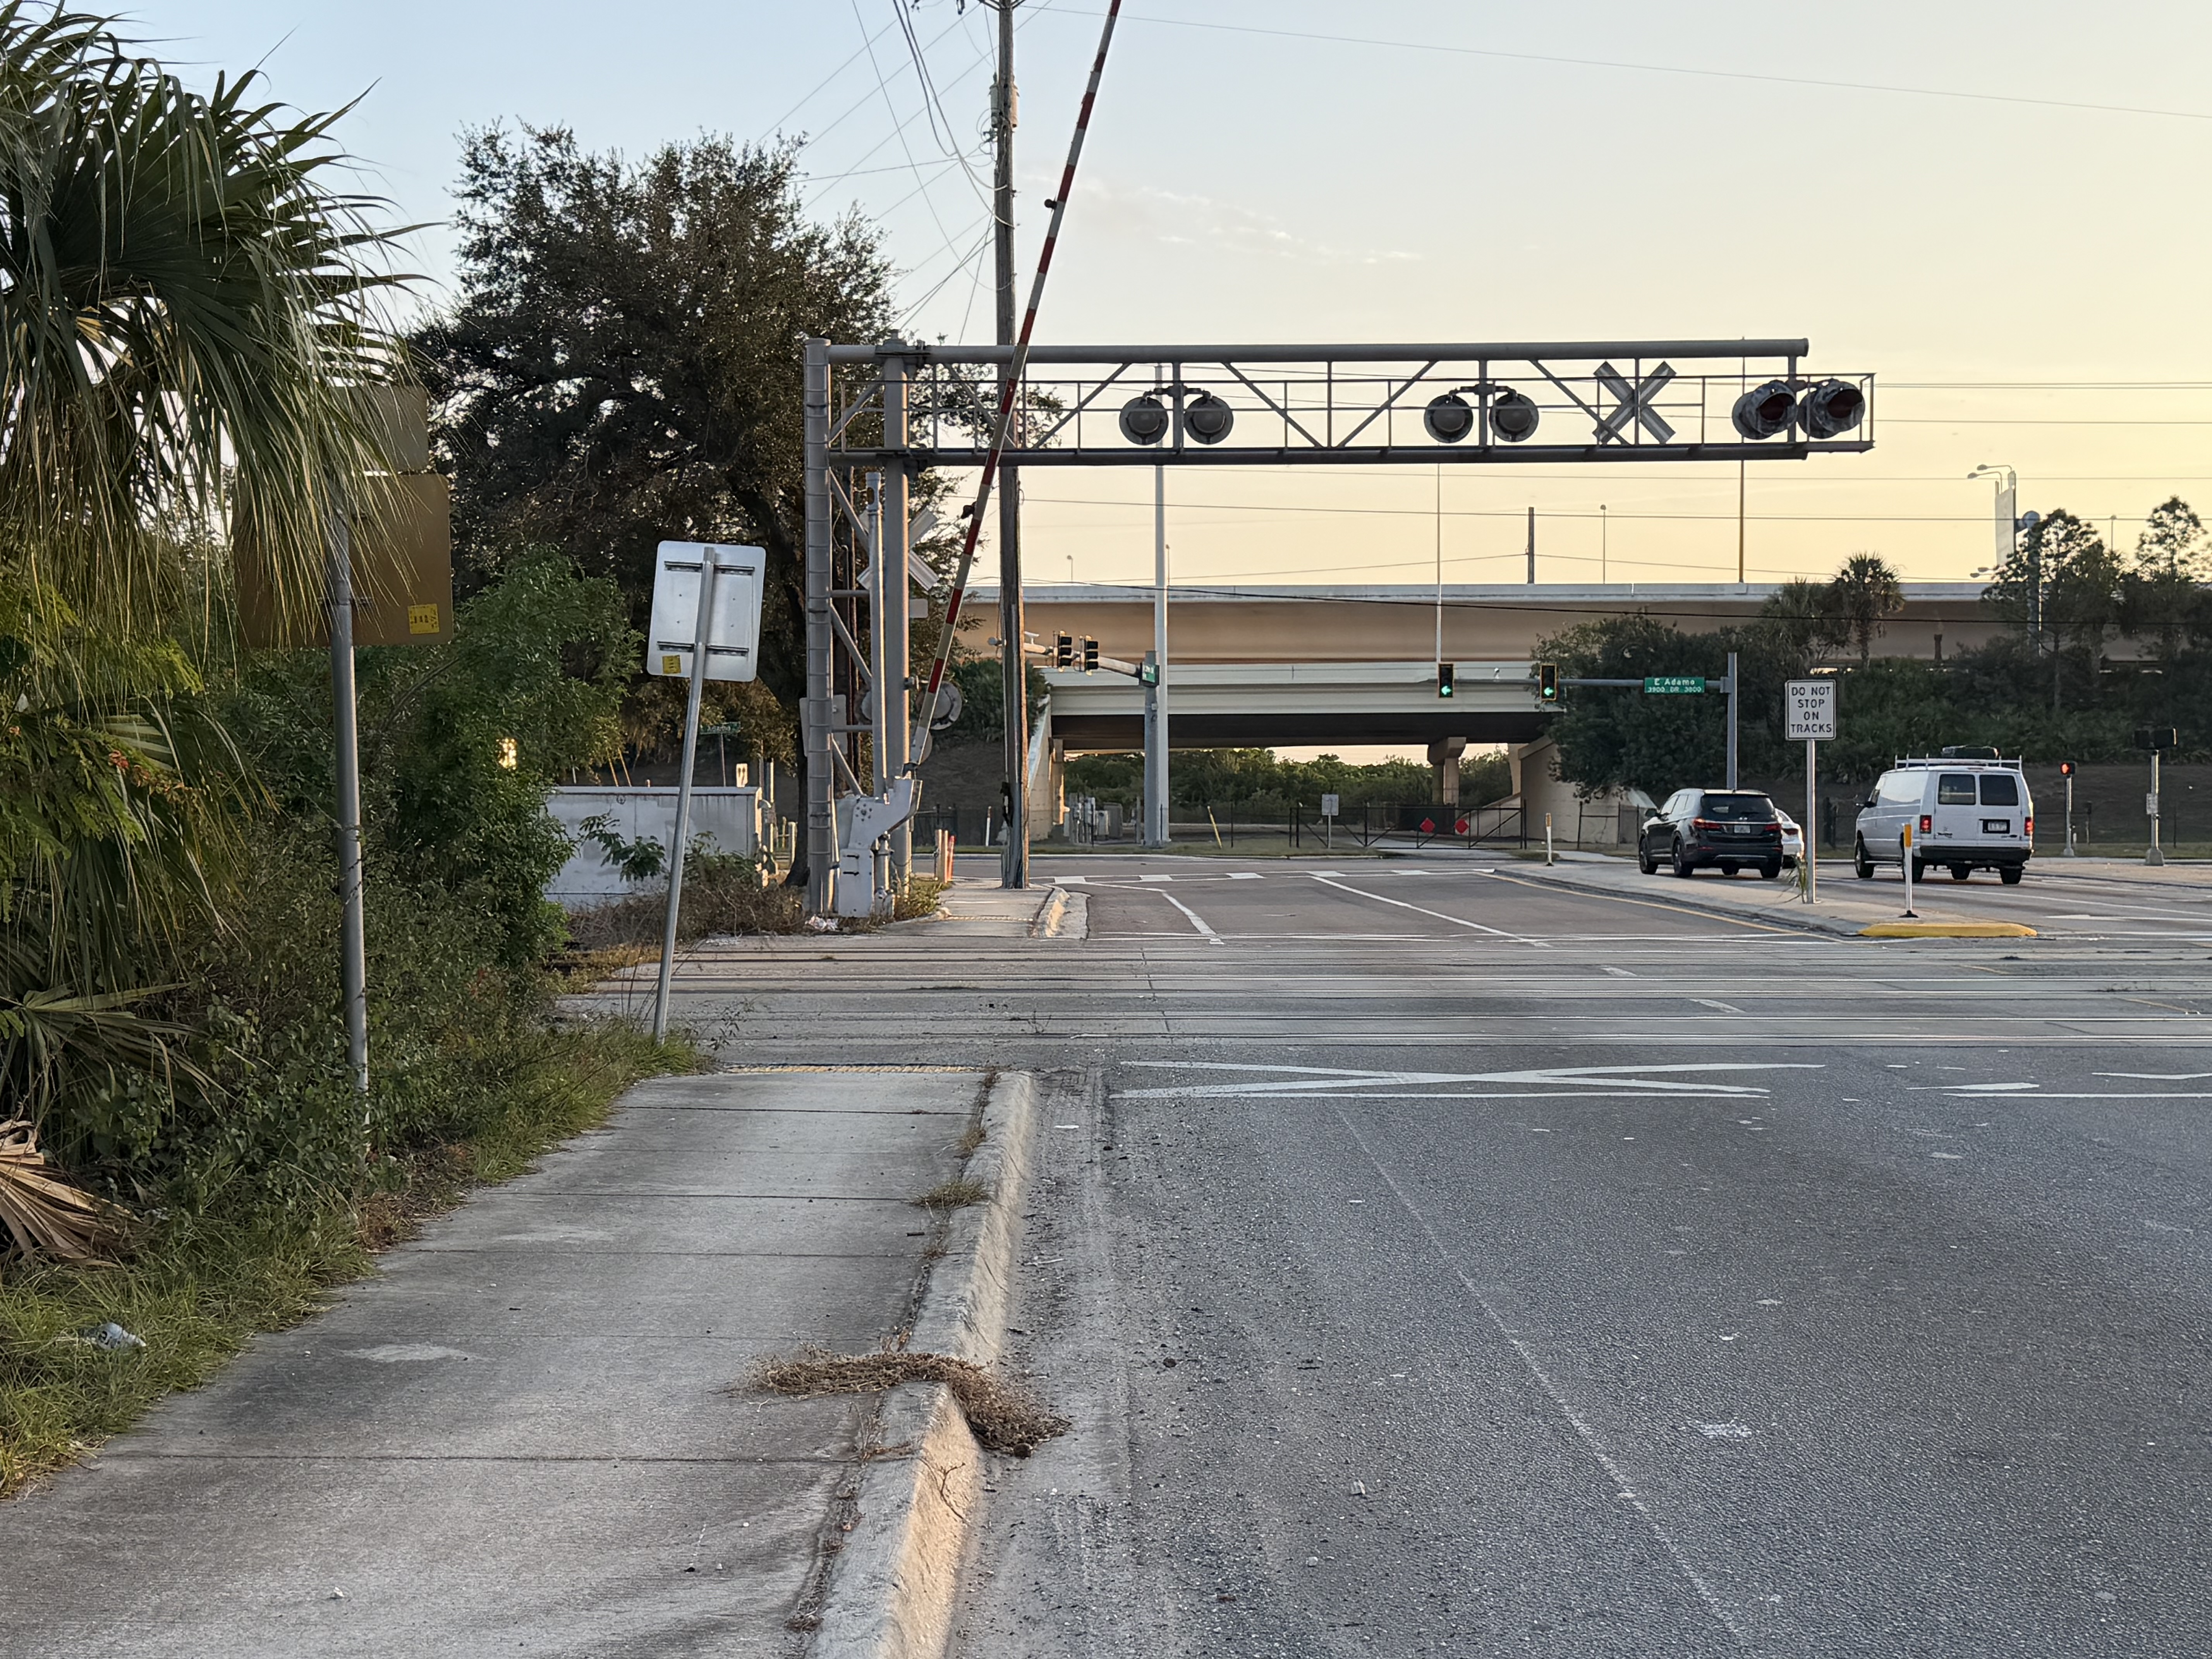
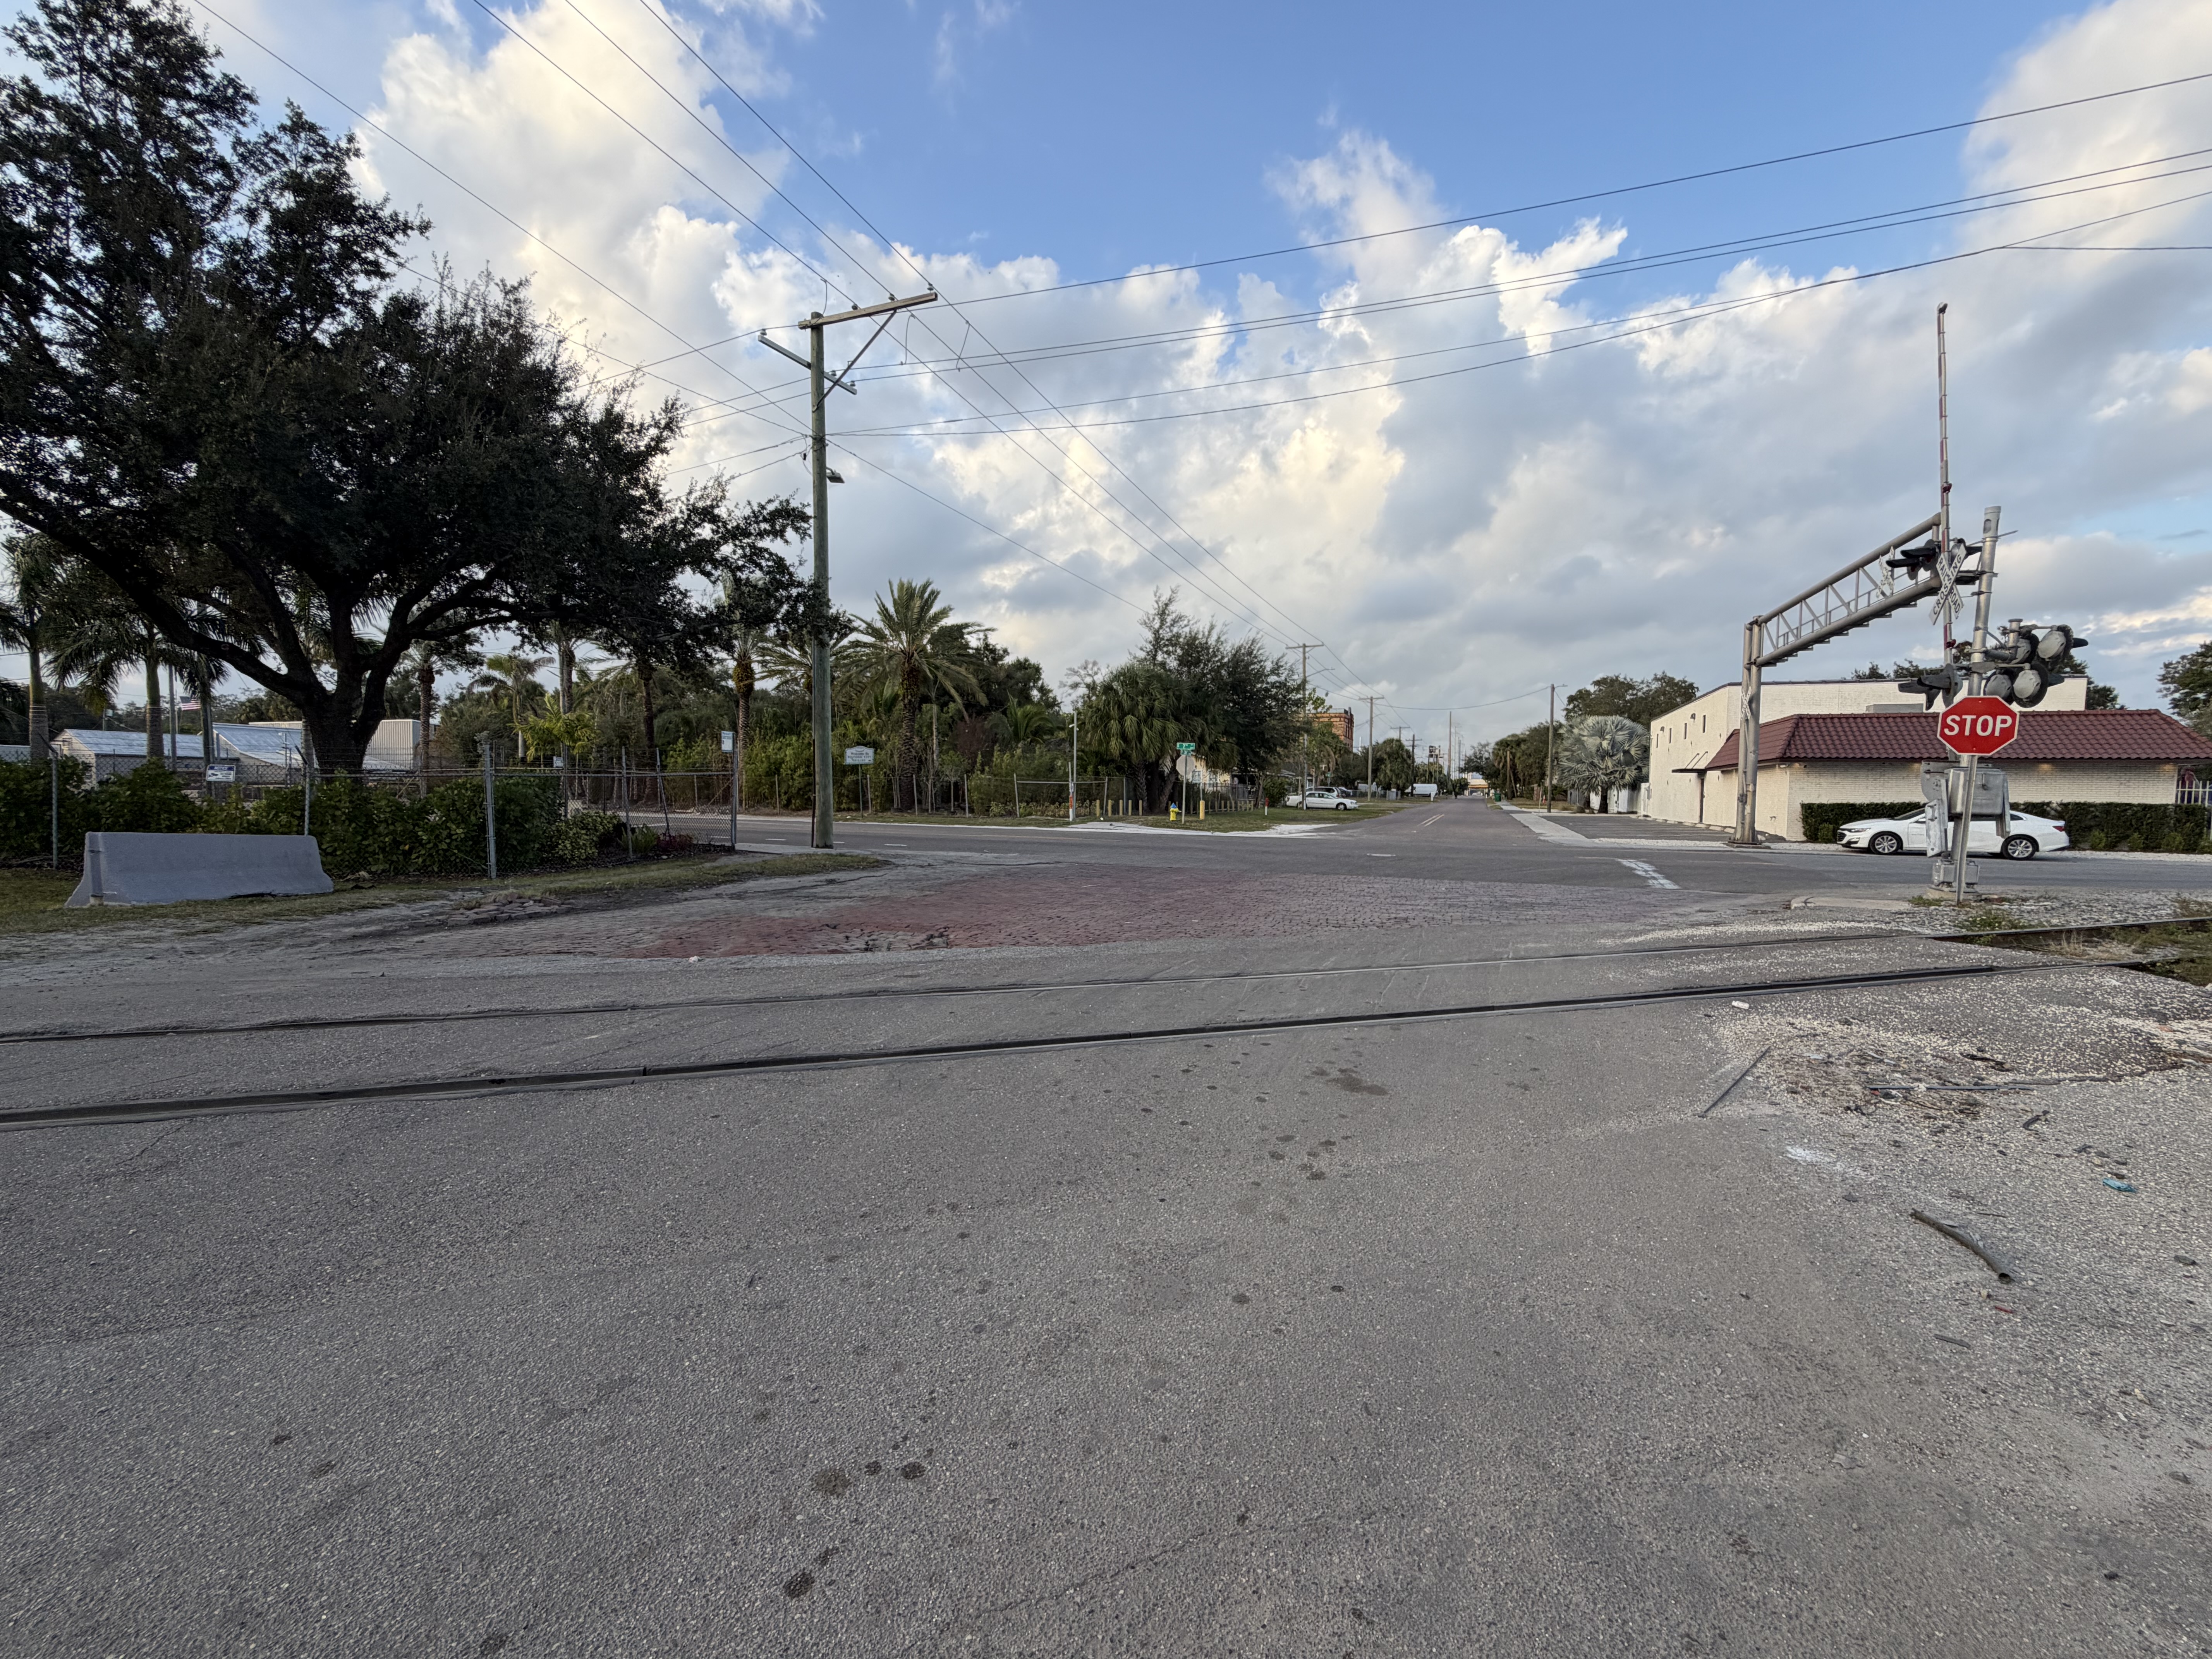
Grade crossing warning infrastructure — cantilever signal mast with active warning devices
Field observation site documenting multi-modal crossing configuration
Section 01
Executive Summary
This document applies the Swiss Cheese Model (SCM) of accident causation — originally developed by James Reason — to analyze failure modes at highway–rail grade crossings where the Safety Digital Box (SDB) provides measurable risk reduction. The primary analysis addresses the double-train awareness failure, in which road users misinterpret continued warning device activation after first-train clearance. The scope extends to single-train scenarios, cyclist-specific vulnerability, one-side pedestrian gate configurations, and signalized pedestrian crosswalk misinterpretation.
A formal reliability model is defined using probability of unsafe entry (Penc) and system reliability (R = 1 − Penc). The model distinguishes between absolute reliability gain and relative unsafe-entry reduction, two metrics that are mathematically distinct and must not be conflated. Illustrative calculations use representative parameter ranges; all values require field validation through controlled observational studies.
1.3 Relationship Between Design-Stage OSR and Behavioral Amplification Modeling
Purpose of This Document Structure
This document integrates two complementary but distinct analytical approaches:
- Design-Stage Overall Safety Reliability (OSR) Framework
- Behavioral Amplification Modeling Using the Swiss Cheese Model
These frameworks serve different purposes and must not be conflated.
A. Design-Stage OSR (System Architecture Reliability)
The OSR framework evaluates the combined effectiveness of independent safety layers at the system design level.
This framework:
- Assumes statistically independent defense layers
- Evaluates structural reliability at the engineering design stage
- Determines whether total layered protection meets target safety thresholds
- Is appropriate for comparing infrastructure configurations
B. Behavioral Amplification Model (Encounter-Level Risk)
The Swiss Cheese behavioral model evaluates encounter-level unsafe entry probability:
This model:
- Does not recompute full structural OSR
- Holds system reliability constant
- This modeling approach isolates marginal reliability improvement attributable to SDB without altering baseline structural defense assumptions.
- Studies dynamic behavioral amplification under specific cognitive conditions
- Quantifies how SDB reduces the behavioral multiplier m
C. Conceptual Integration
In this document:
- OSR defines baseline system reliability
- Behavioral amplification modeling quantifies marginal reliability gain of SDB during high-risk behavioral windows
- SDB improves overall safety by reducing the dominant behavioral failure multiplier rather than by replacing physical barriers
These approaches are complementary:
| Framework | Domain |
|---|---|
| OSR | Structural reliability |
| Behavior model | Dynamic vulnerability amplification |
Together they provide a complete safety case.
Final Clarification
The behavioral amplification modeling in Sections 5–12 assumes a fixed baseline OSR and isolates the incremental reliability improvement attributable to SDB during high-risk temporal windows. This avoids double-counting structural defense layers and preserves analytical rigor.
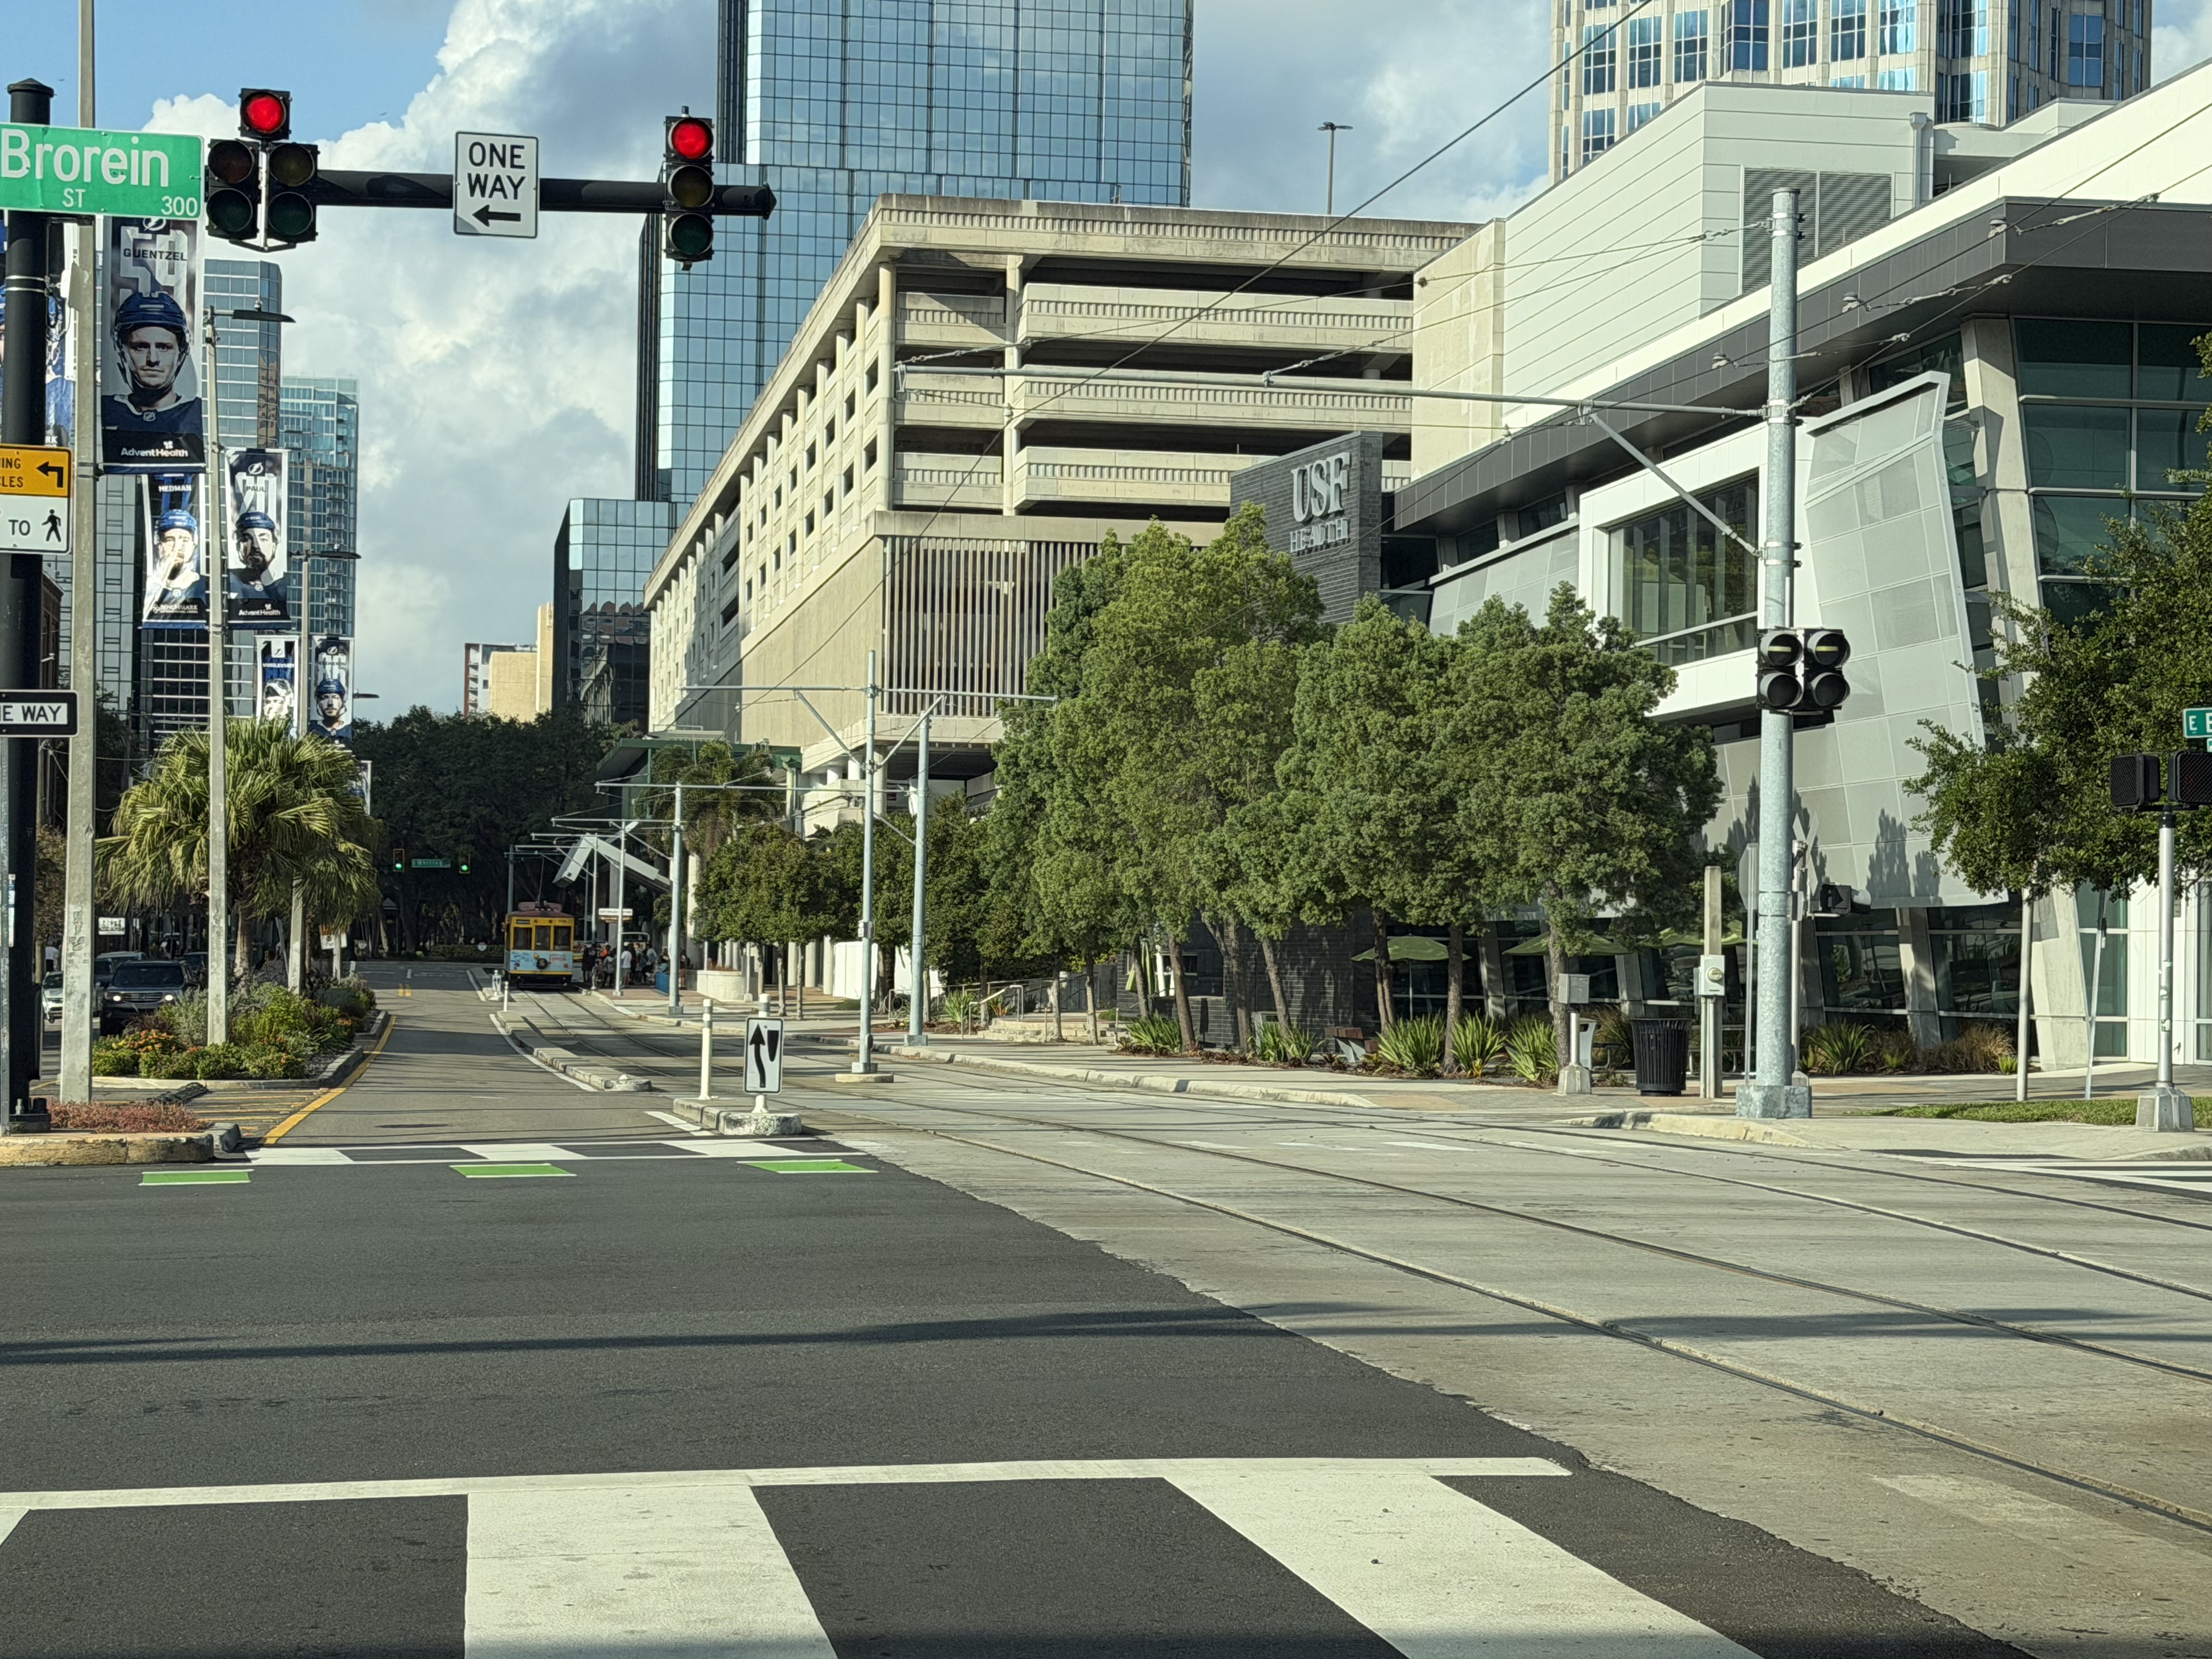
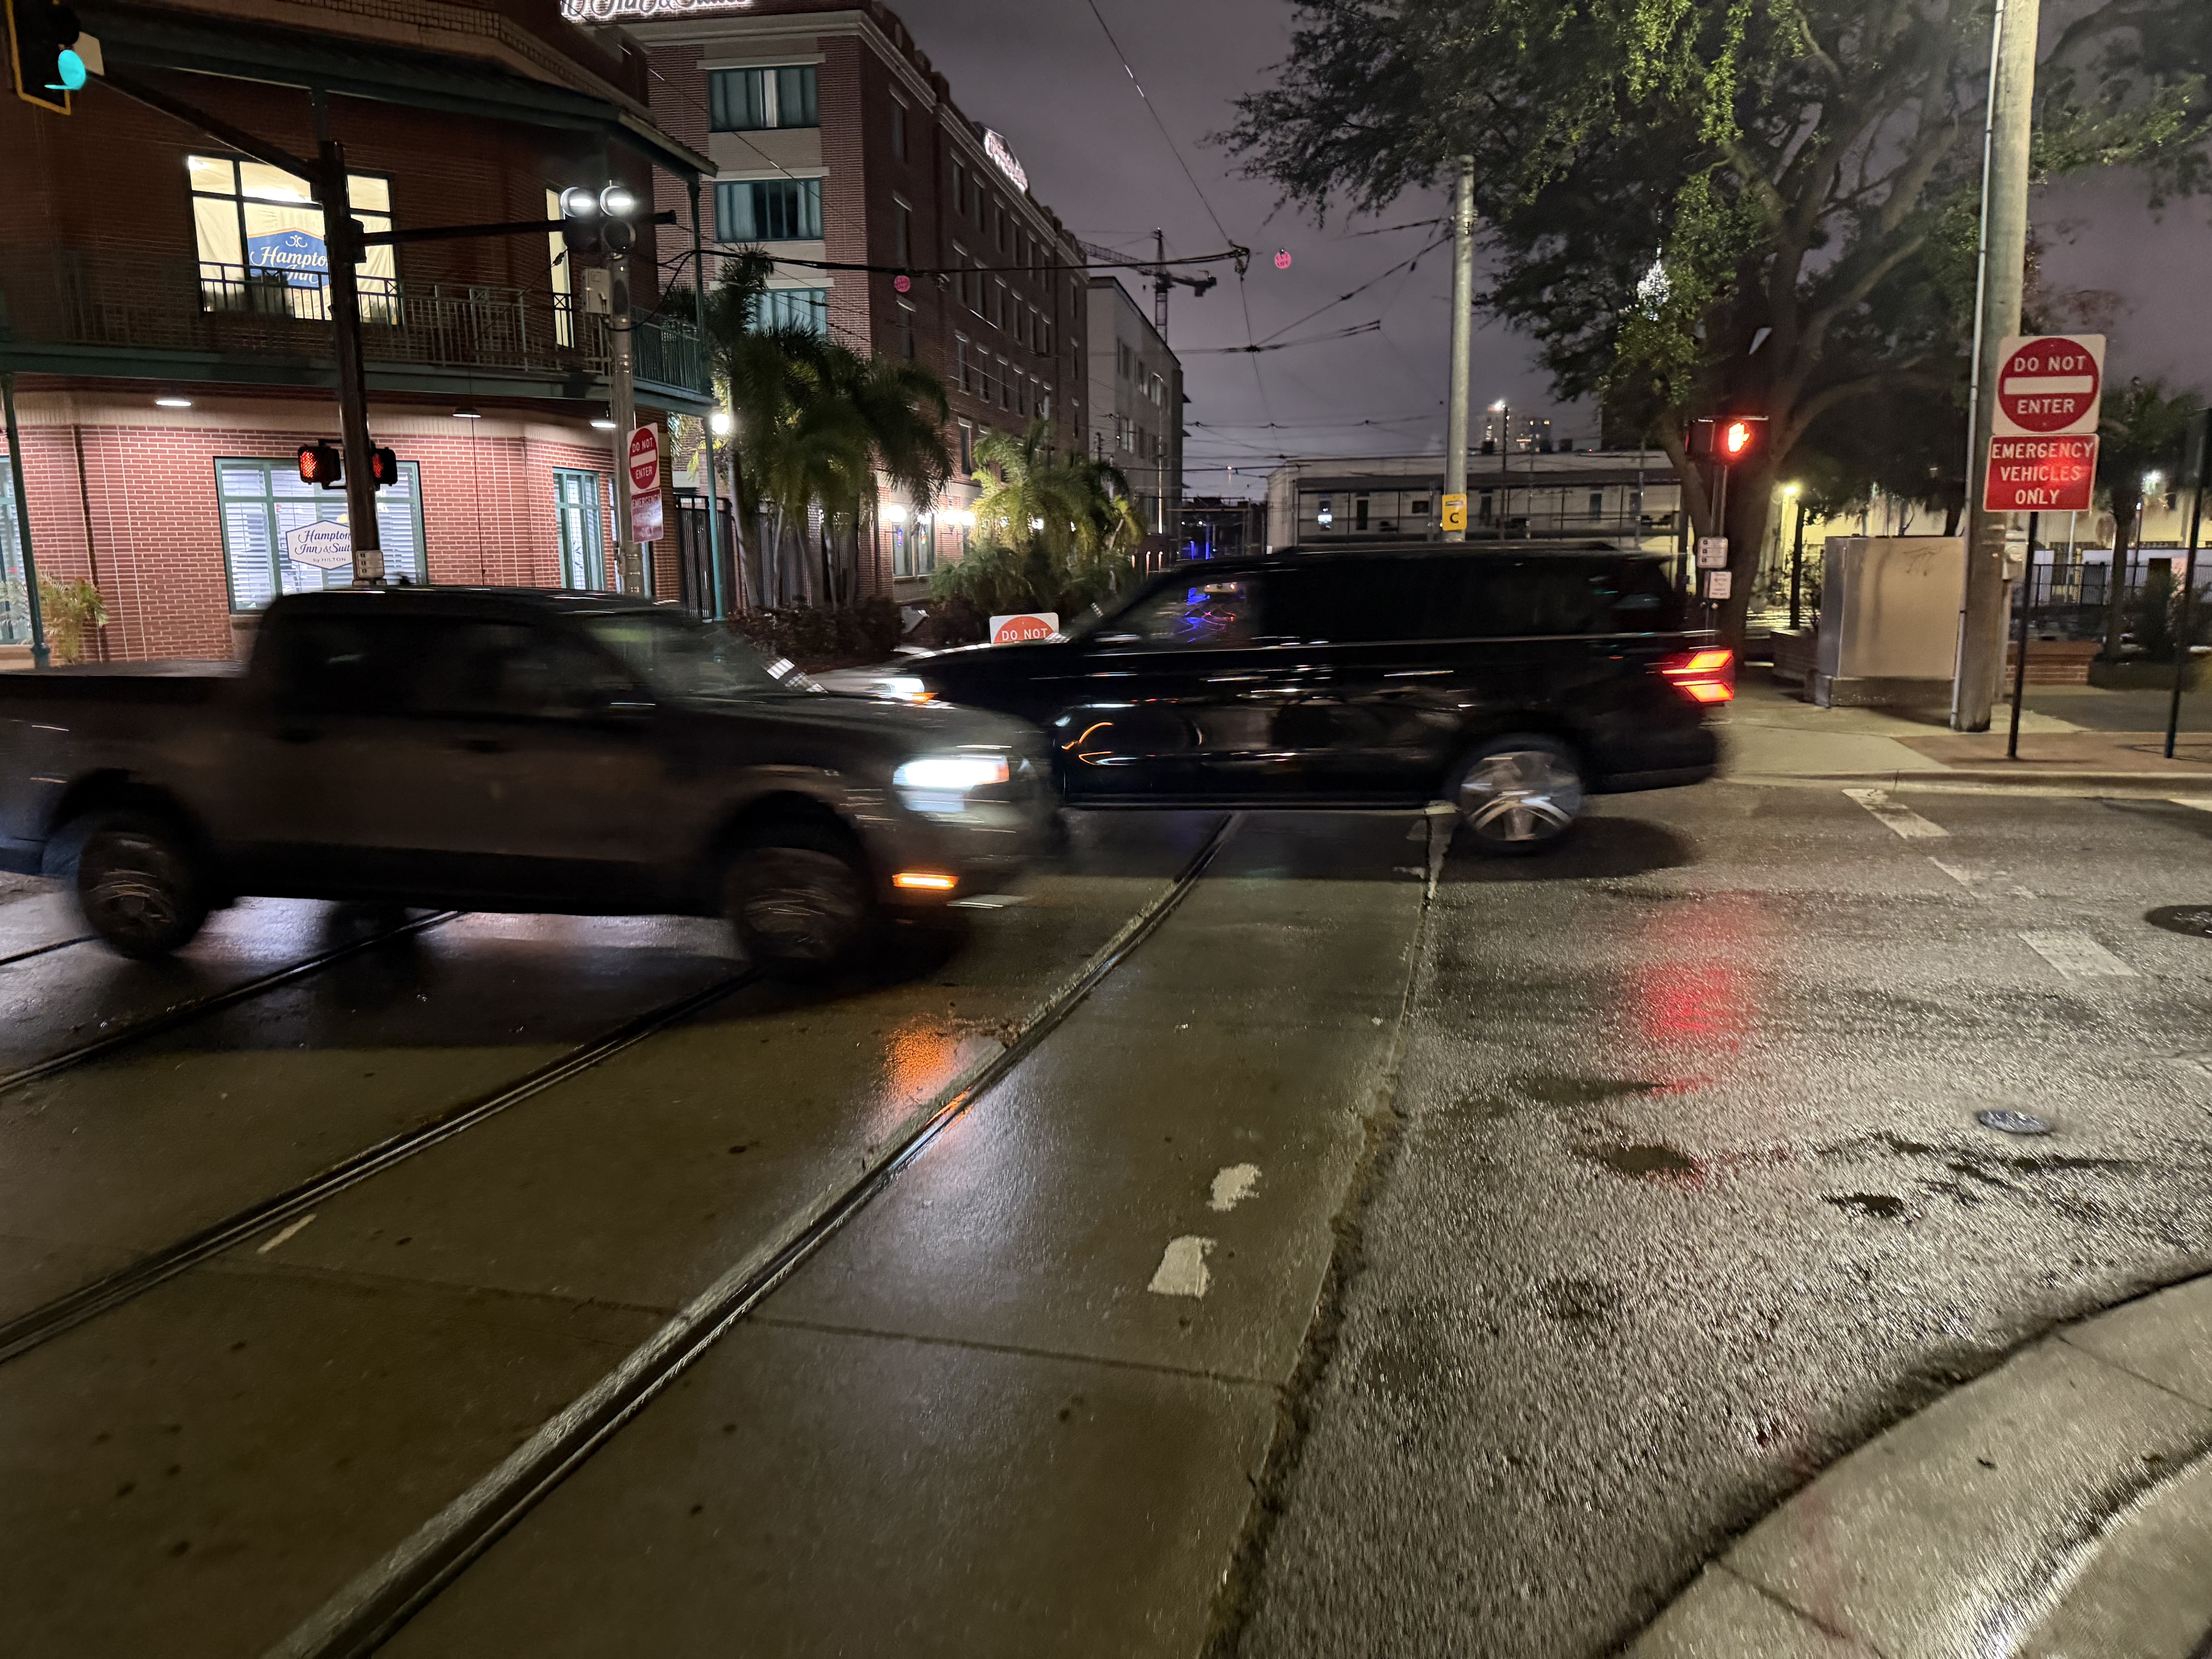
Signalized urban crossing with pedestrian infrastructure, traffic signals, and embedded rail tracks
Example of complex multi-modal intersection where vehicle and rail hazard cues overlap
Section 02
The Problem: Second-Train Illusion
2.1 Behavioral Failure Mode Definition
The "second-train illusion" (also termed the multiple-train hazard misinterpretation) is a cognitive failure in which a road user at a grade crossing:
- Observes the first train pass and clear the crossing
- Expects the warning devices (flashers, bells, gates) to deactivate
- Experiences cognitive dissonance when warnings continue
- Rationalizes the continued activation as malfunction, delay, or system error
- Initiates crossing movement before the second train arrives
2.2 Information Stagnation in Traditional Warning Systems
The Information Stagnation Problem
After the first train passes, traditional warning devices continue to present identical stimuli: the same red flashers, the same bell pattern, the same gate position. The warning system provides no new information to distinguish between "warning is ending" and "a second train is approaching." This information vacuum forces users to rely on internal cognitive models — which are biased toward the single-train assumption. The result is a measurable increase in violation probability during the inter-train interval.
2.3 Vulnerable User Groups
Pedestrians
- Primary decision input is visual; identical flashers provide no new signal
- No physical barrier in many one-side gate configurations
- Near-zero decision-to-crossing latency
- Social queue pressure during extended warning activation
- Headphone use reduces auditory awareness
Cyclists (Primary Quantified Case)
- Higher crossing speed reduces available reaction time
- Committed trajectory once movement initiated
- Circumvent half-gate configurations with minimal effort
- Reduced auditory perception at speed; wind noise masking
- Balance constraints limit sudden stops on rail surfaces
Pedestrian-level view of crossing at dusk — reduced visibility conditions amplify second-train illusion risk
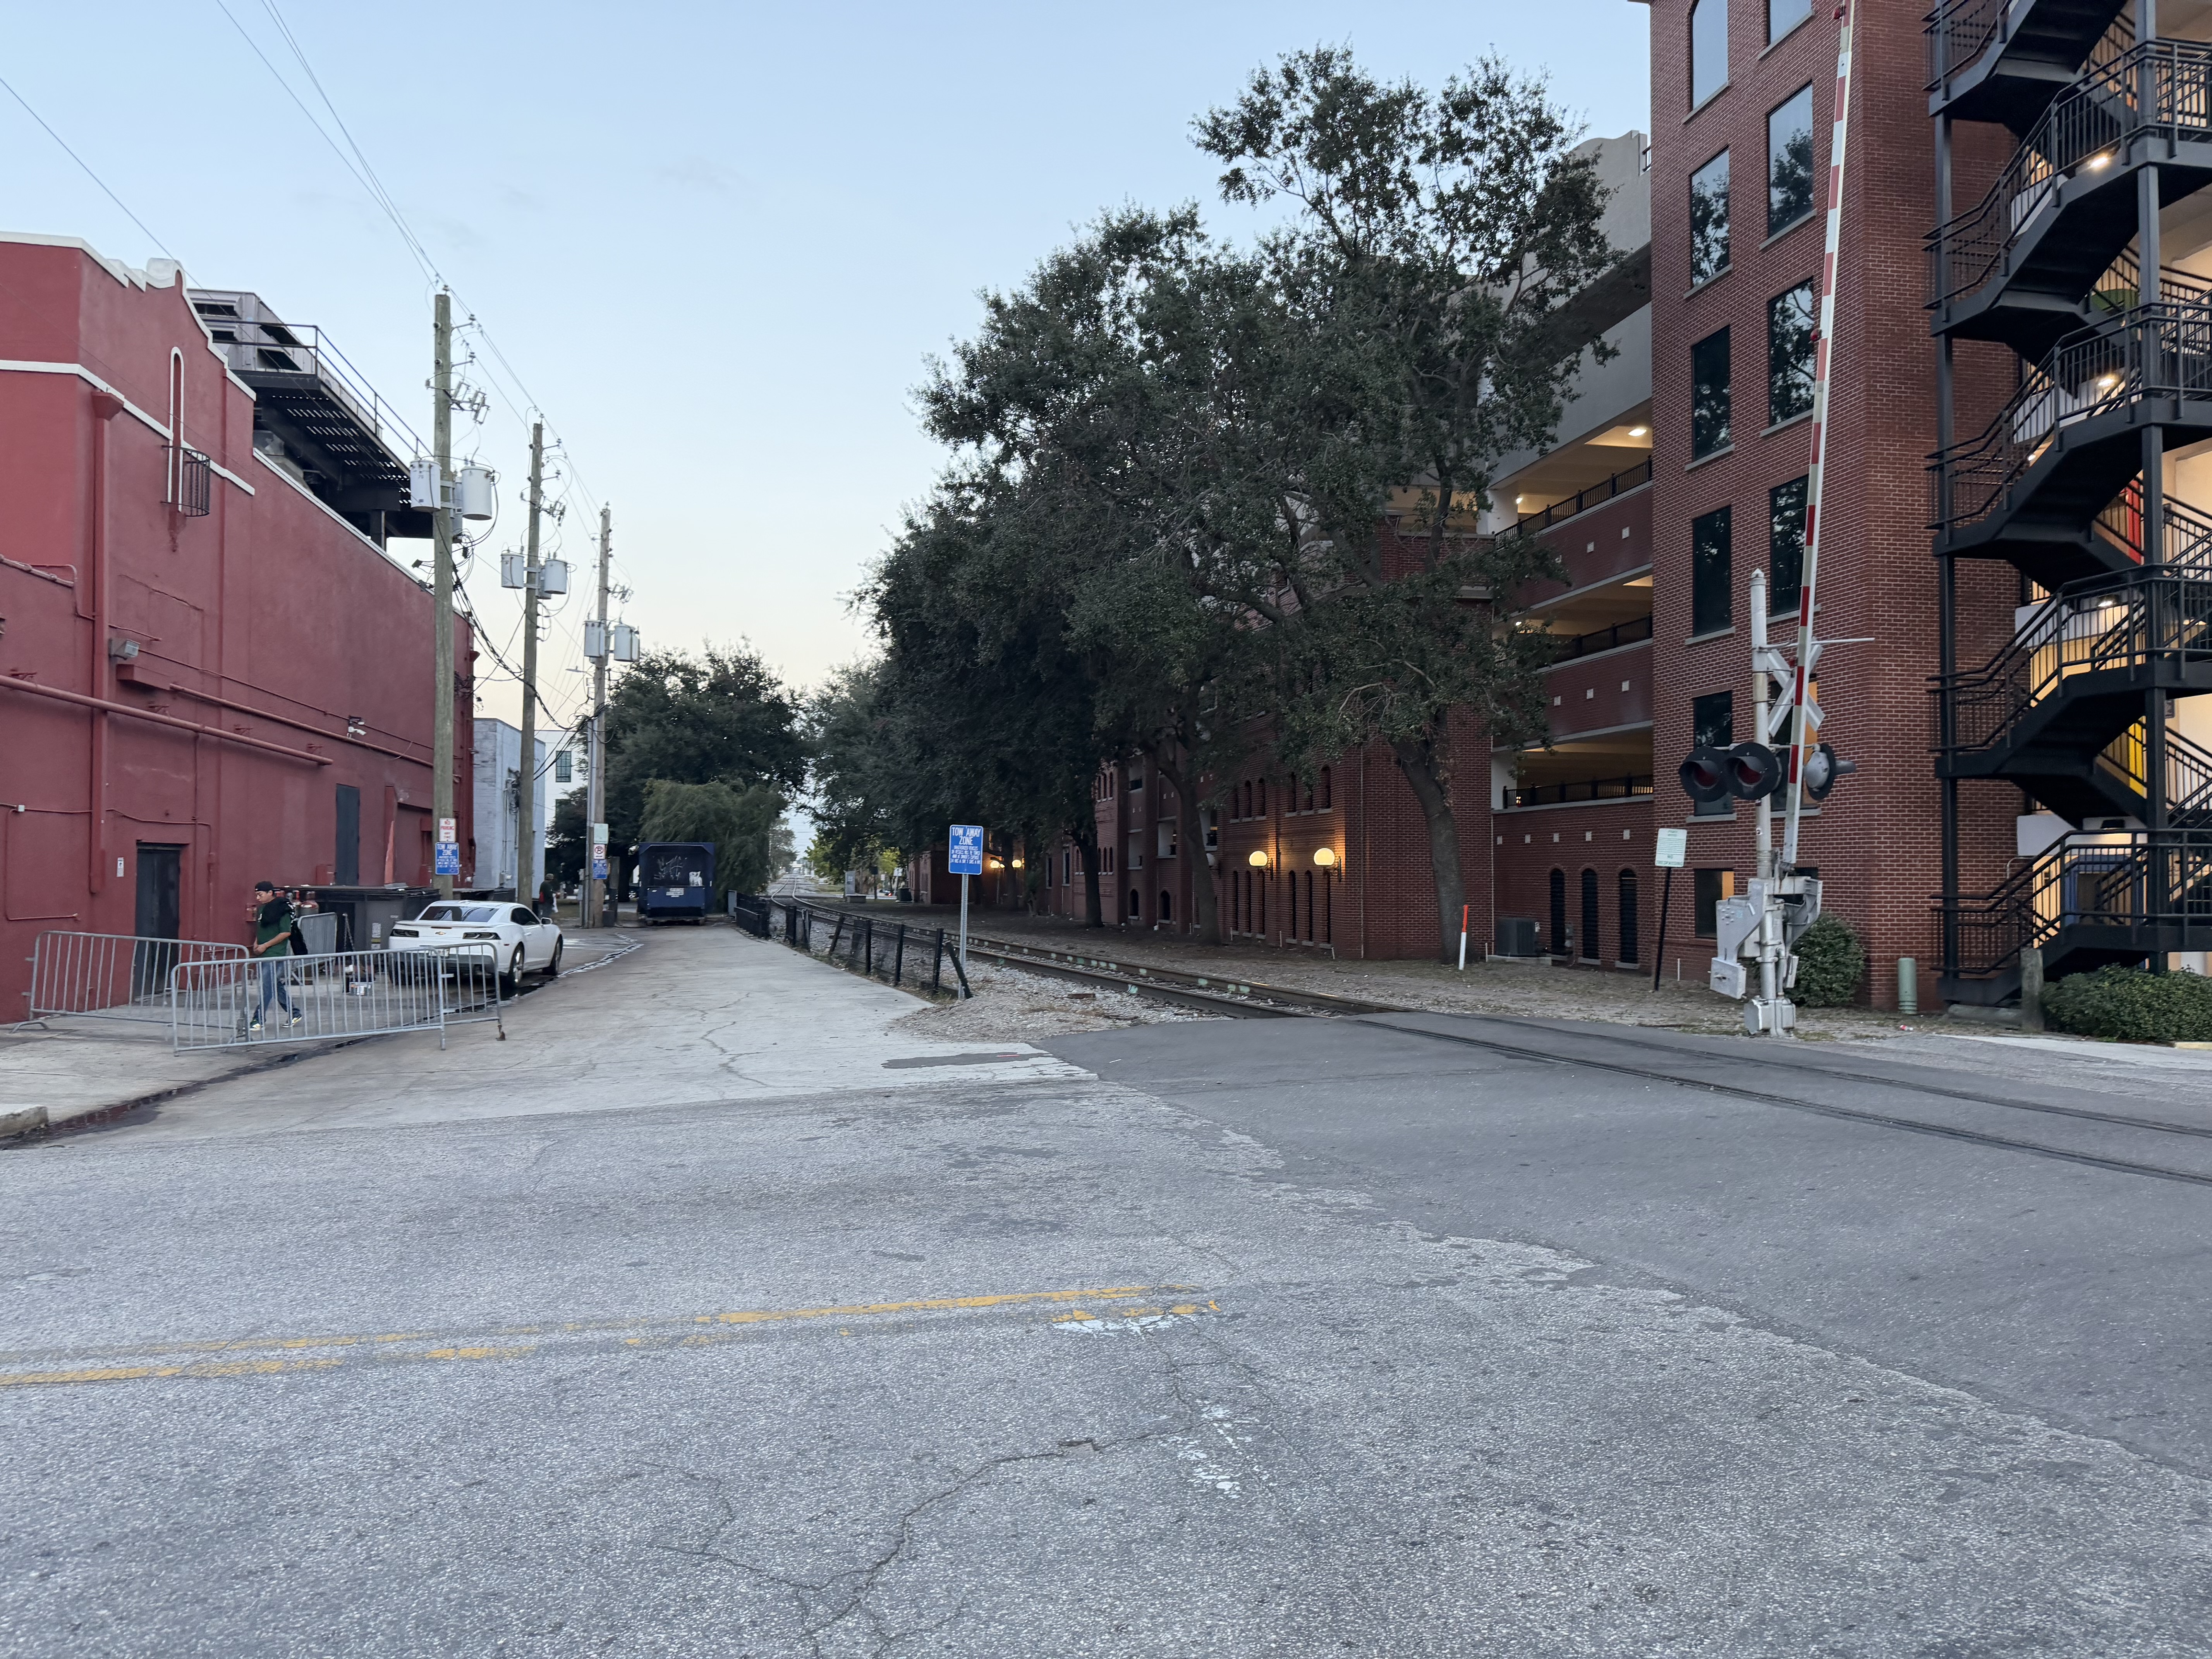
Urban crossing with confined sightlines — limited visual envelope increases hazard misinterpretation probability
Section 03
Swiss Cheese Model Framework
3.1 Reason's Swiss Cheese Model Applied to Grade Crossings
In the Swiss Cheese Model, each defensive layer is represented as a slice of cheese with "holes" representing weaknesses. An accident occurs when holes in successive layers momentarily align, allowing a hazard trajectory to penetrate all defenses. At grade crossings, the defense layers are:
| Defense Layer | Function | Failure Characteristics |
|---|---|---|
| Layer 1: Signage | Static advance warning (crossbuck, W10 signs) | Low variability; static failure mode |
| Layer 2: Flashers | Active visual warning of train presence | Effectiveness degrades with prolonged identical activation |
| Layer 3: Bell/Audible | Auditory hazard alert | Reduced by ambient noise, headphones, habituation |
| Layer 4: Gate | Physical barrier to entry | Effective for vehicles; limited for pedestrians/cyclists in one-side configurations |
| Layer 5: SDB Display | Dynamic visual hazard confirmation | Supplemental layer — characterized in Section 4 |
| Layer 6: User Compliance | Behavioral decision to wait | Highly variable — subject to behavioral amplification in double-train scenario |
3.2 Temporal Hole-Enlargement During Double-Train Events
The critical insight of this analysis is that Swiss Cheese holes are not static. During a double-train event, the user compliance failure probability undergoes significant increase in the temporal window after first-train clearance. Three cognitive mechanisms drive this increase:
Users expect warning cessation; continued activation triggers cognitive override of warning validity
Extended exposure to identical stimuli reduces perceived urgency
Users attribute continued activation to device error
3.3 Defense Alignment in Probability Terms
In the Swiss Cheese Model, the probability of a hazard trajectory penetrating all layers is a function of each layer's failure probability. When the user compliance failure probability increases, the overall penetration probability increases — potentially dominated by the weakest layer. The formal model in Section 5 defines these relationships explicitly.
Notation Convention: Throughout this document, Penc denotes the probability of unsafe entry (hazard trajectory penetration). Reliability R = 1 − Penc. These are defined formally in Section 5. All illustrative parameter values are based on behavioral literature ranges and require field validation.
Multiple defense layers at a single crossing — static signage, flashers, cantilever signals, and pavement markings
Each visible element represents a Swiss Cheese barrier slice with independent failure probability
Section 04
Temporal Swiss Cheese Analysis: Three Phases
The following diagram illustrates how defense layer failure probabilities change across three critical temporal phases of a double-train event. Hole sizes represent qualitative failure probability — formalized quantitatively in Section 5.
Figure 1 — Temporal Swiss Cheese Model: Defense layer failure probabilities across three phases of a double-train event. Phase 2 shows elevated user compliance failure without SDB (m ≈ 3–5). Phase 3 shows SDB intervention reducing the behavioral multiplier (m ≈ 1.3–1.8).
Nighttime crossing conditions — vehicles traverse tracks under active red signal indication
Reduced visual acuity and competing light sources increase behavioral amplification multiplier during temporal risk windows
Section 05
Quantified Defense Penetration Model
5.1 Model Definition
The probability that a road user makes an unsafe entry into the crossing is modeled as the joint probability of system-side failure and user-side violation:
Puser = probability that the user violates the crossing during active, functional warning
Penc = total probability of unsafe entry (system failure OR user violation given working system)
5.2 Double-Train Behavioral Amplification
During double-train events, user violation probability increases by a behavioral amplification multiplier m:
Puser,d = double-train user violation probability
m = behavioral amplification multiplier
mwithout SDB ≈ 3–5 (driven by expectation violation, habituation, malfunction attribution)
mwith SDB ≈ 1.3–1.8 (SDB provides new information at each stage, counteracting cognitive degradation)
5.3 Distinguishing Absolute Gain from Relative Reduction
Critical Distinction
Absolute reliability gain ≠ Relative unsafe-entry reduction
These two metrics describe different aspects of improvement and must not be conflated:
- Absolute reliability gain = RSDB − Rbaseline — the arithmetic difference in reliability (probability units)
- Relative unsafe-entry reduction = (Penc,baseline − Penc,SDB) / Penc,baseline — the fractional reduction in unsafe entries
A system that improves R from 0.900 to 0.960 has an absolute gain of 0.060 but a relative unsafe-entry reduction of 60% (from 0.100 to 0.040). Both are valid; neither should be presented without context.
5.4 Parameter Ranges
| Parameter | Symbol | Representative Range | Basis |
|---|---|---|---|
| System unavailability | Psys | 0.001 – 0.005 | FRA crossing inventory reliability data |
| Baseline pedestrian violation | Puser,s (ped) | 0.02 – 0.04 | Behavioral observation literature |
| Baseline cyclist violation | Puser,s (cyc) | 0.03 – 0.04 | Higher than pedestrian due to momentum commitment |
| Baseline vehicle violation | Puser,s (veh) | 0.005 – 0.01 | Gate provides physical deterrent |
| Double-train multiplier (no SDB) | mno SDB | 3 – 5 | Cognitive failure mode analysis |
| Double-train multiplier (with SDB) | mSDB | 1.3 – 1.8 | SDB stage-transition information injection |
Section 06
Cyclist Reliability Model — Primary Quantified Case
The cyclist is selected as the primary quantified example because cyclists combine high vulnerability (momentum commitment, balance constraints, gate circumvention capability) with measurable baseline violation rates. This section presents the full calculation using the model defined in Section 5.
6.1 Input Parameters
Puser,s = 0.035 (baseline single-train cyclist violation, midpoint of 0.03–0.04 range)
mno SDB = 3.0 (double-train multiplier without SDB)
mSDB = 1.4 (double-train multiplier with SDB)
6.2 Baseline Double-Train (Without SDB)
= 0.002 + (1 − 0.002) × 0.105
= 0.002 + 0.998 × 0.105
= 0.002 + 0.10479
= 0.10679
6.3 Double-Train With SDB
= 0.002 + 0.998 × 0.049
= 0.002 + 0.04890
= 0.05090
6.4 Computed Metrics
R_SDB − R_baseline = 0.94910 − 0.89321
(0.10679 − 0.05090) / 0.10679 = 0.5237
Interpretation
For the cyclist double-train scenario with the selected parameters, SDB yields an absolute reliability improvement of approximately 5.6 percentage points (from 89.3% to 94.9%). Equivalently, among cyclists who would have made unsafe entries without SDB, approximately 52% are redirected to compliant behavior. These two metrics — absolute gain and relative reduction — describe different aspects of the same intervention and should be reported together.
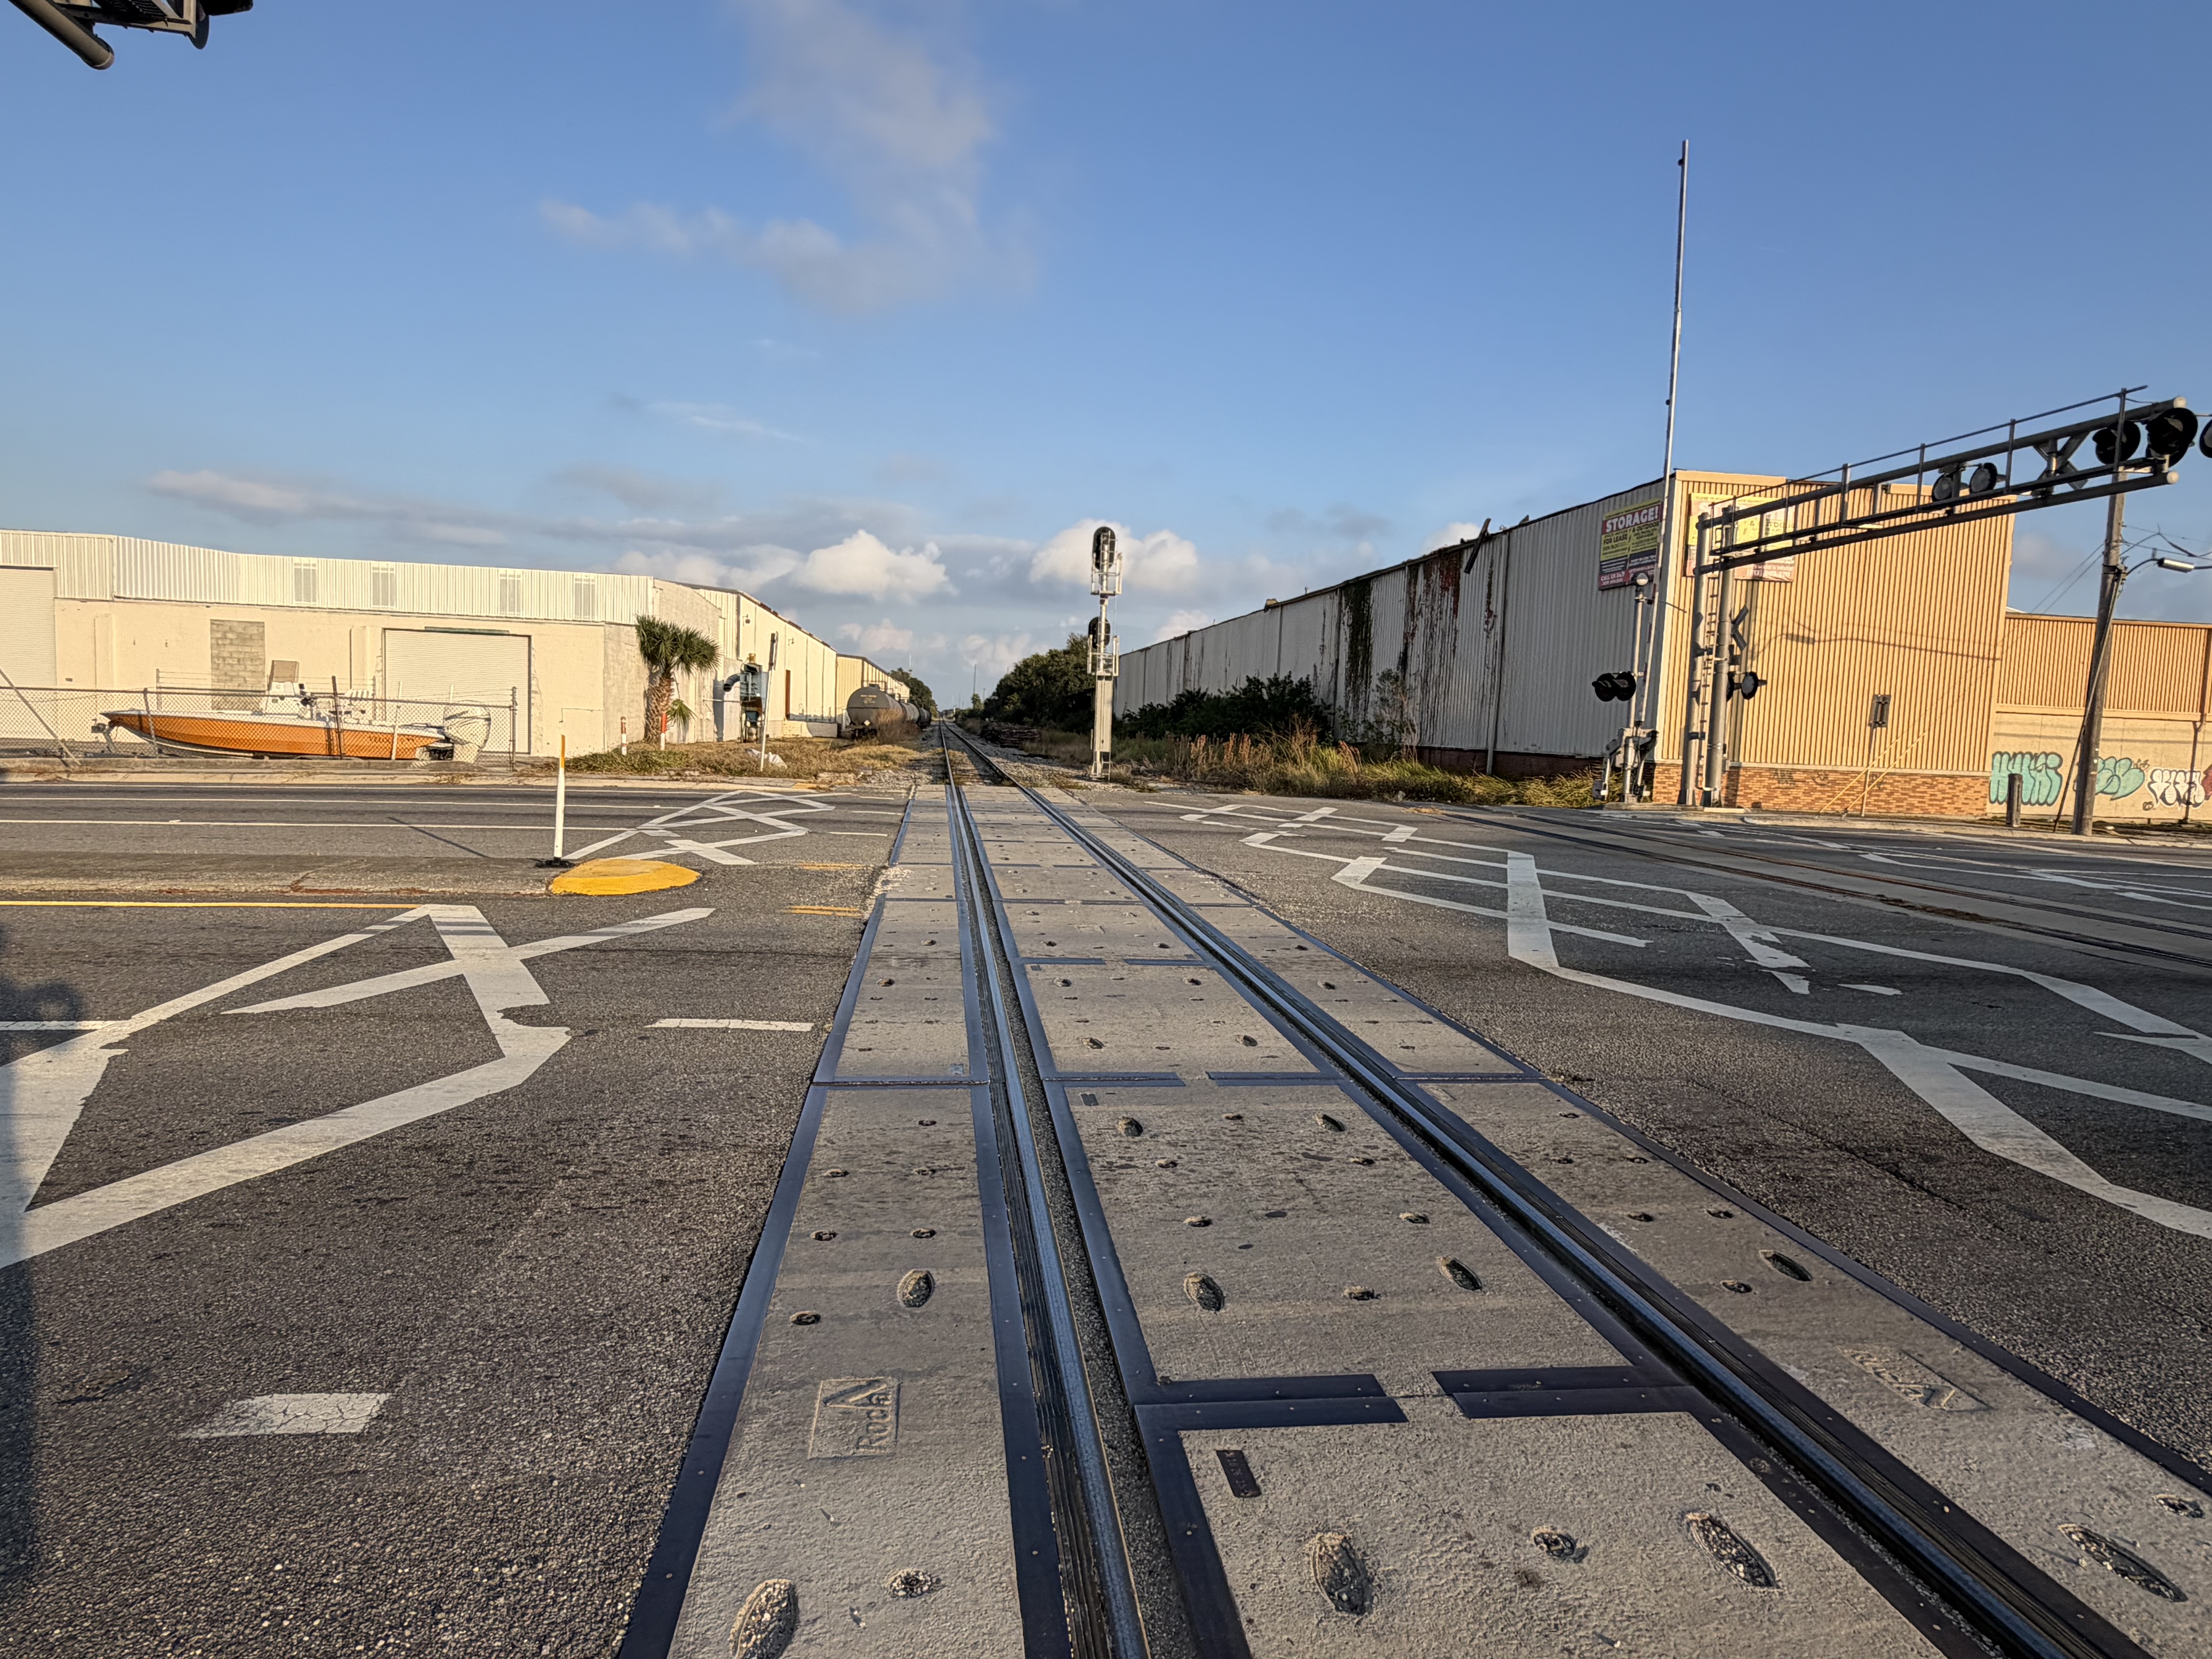
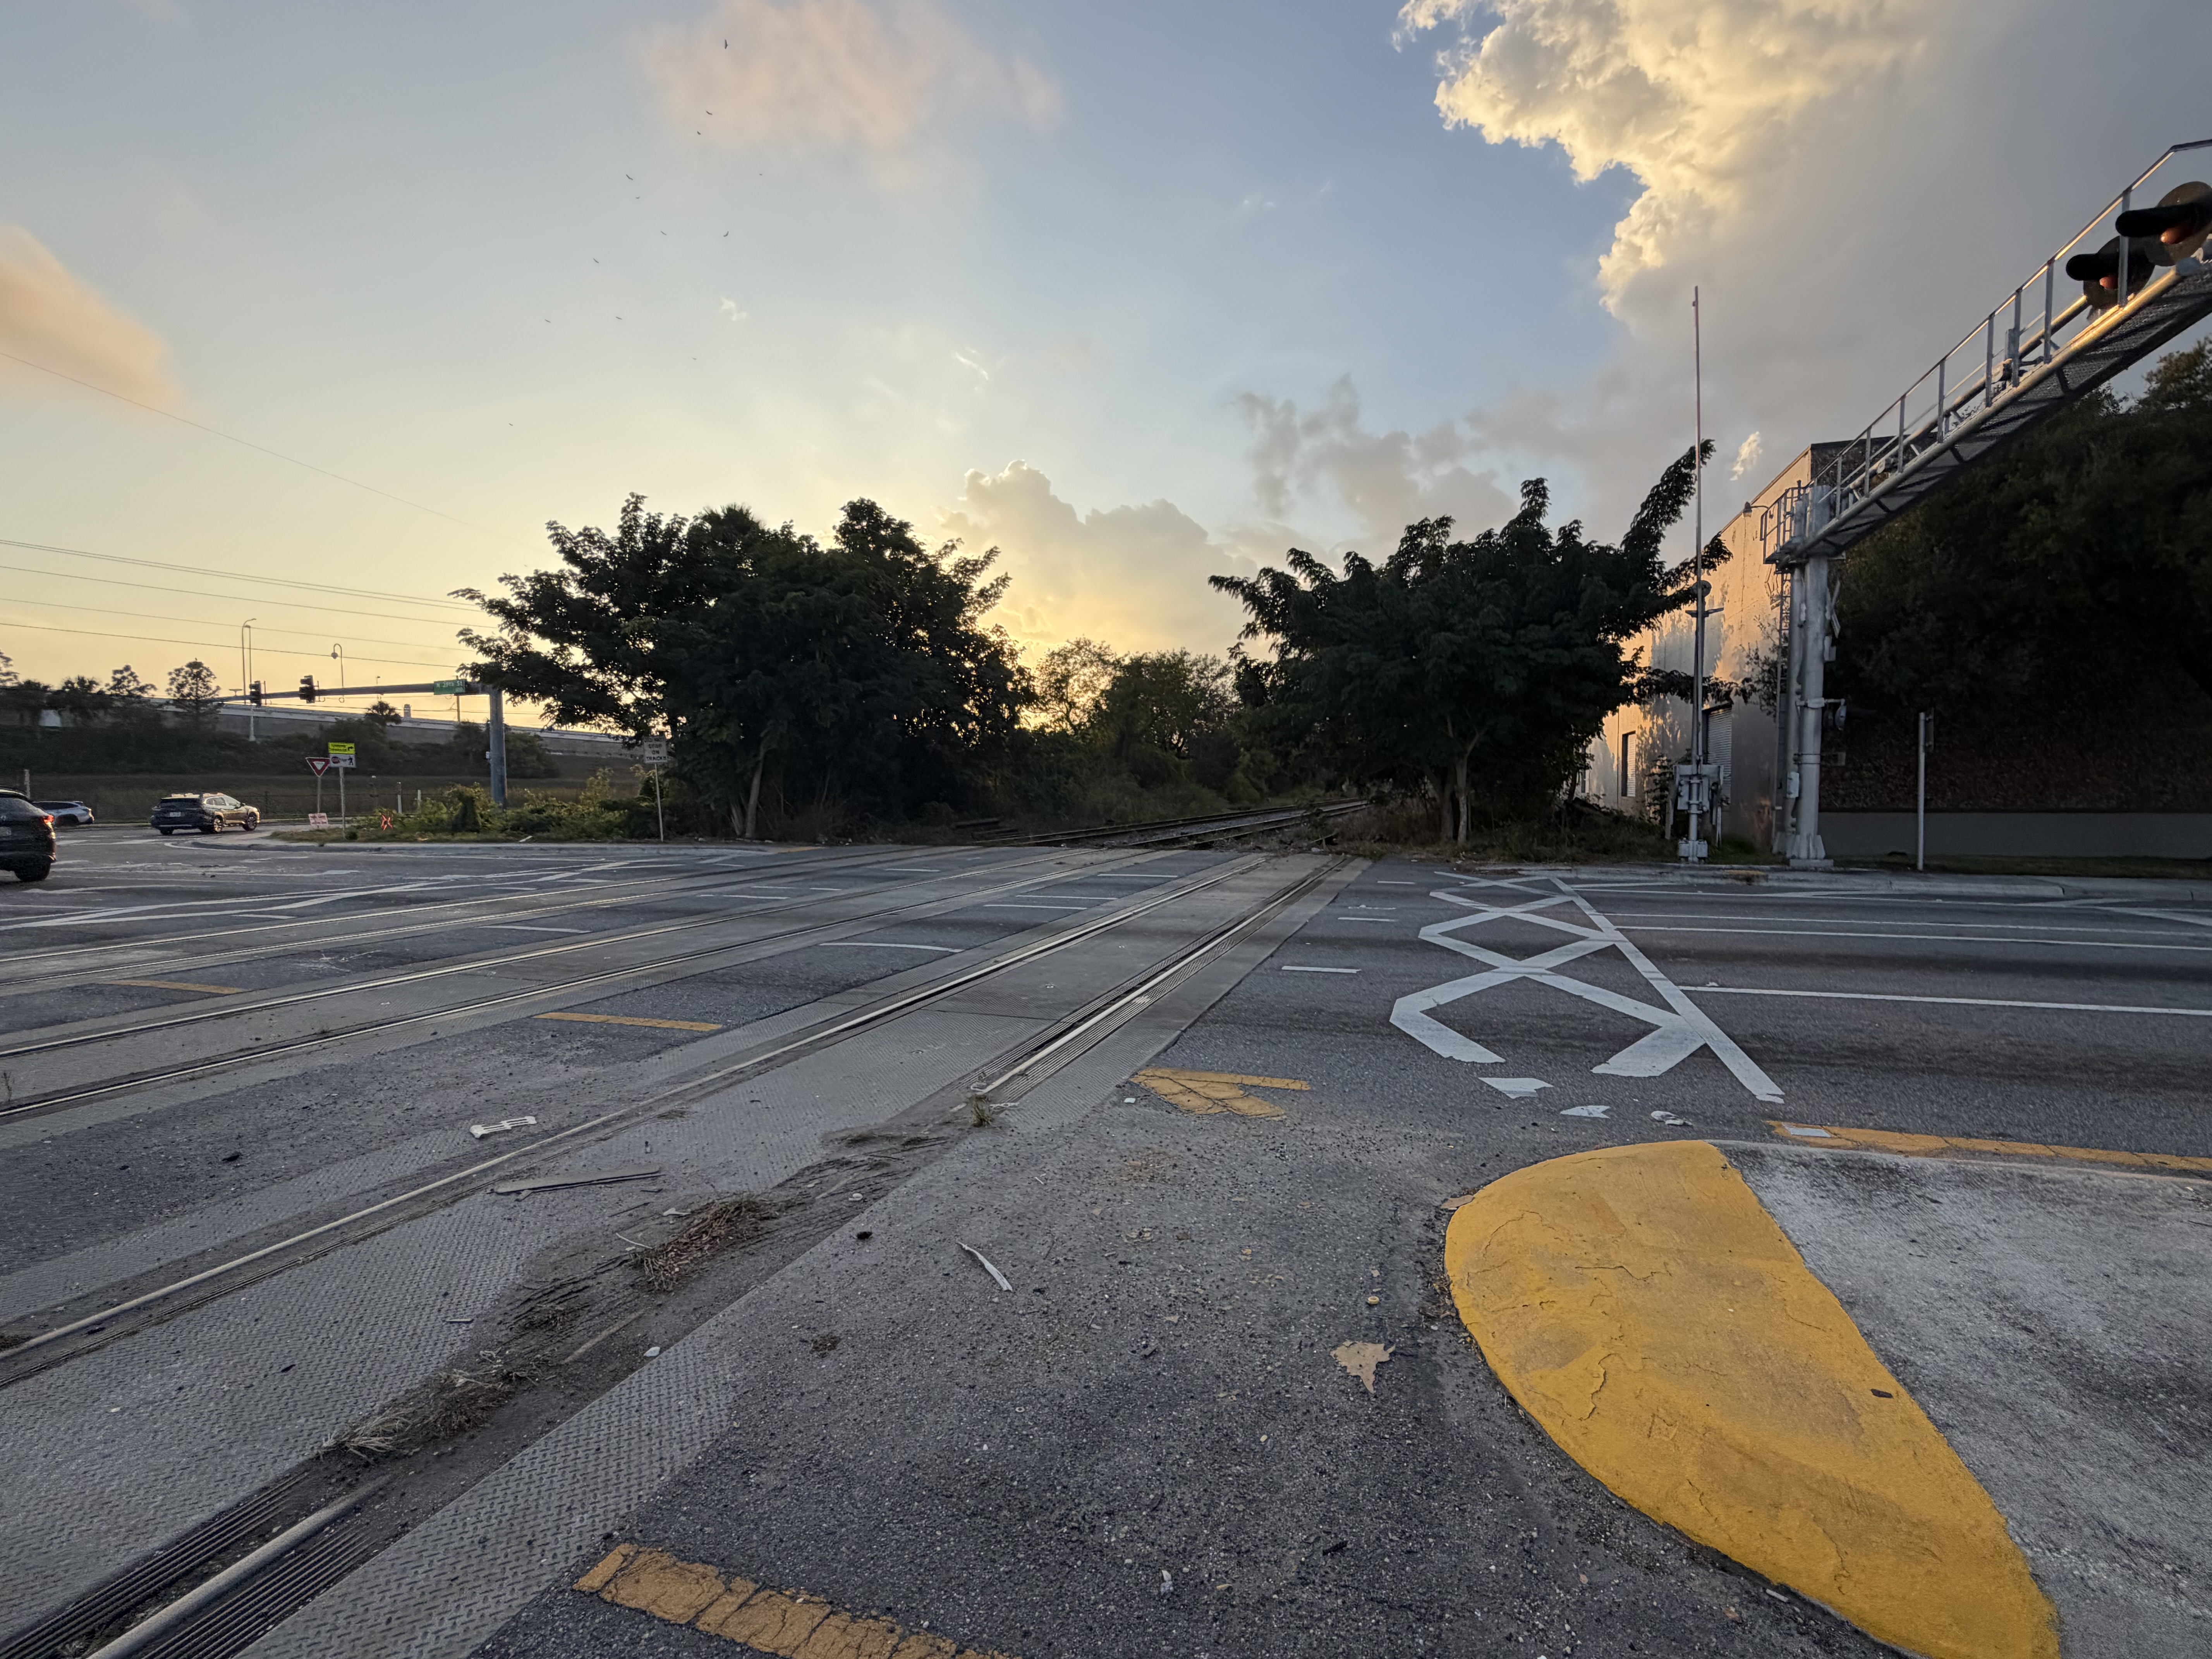
Open crossing with minimal pedestrian infrastructure — cyclist and vehicle exposure zones with limited barrier depth
Crossing configuration where baseline violation probability P_user is elevated due to reduced visual deterrents
Section 07
Single-Train Scenario Enhancement
While the double-train scenario represents the most acute failure mode, SDB also provides measurable benefit during standard single-train events. The mechanism differs: rather than counteracting a behavioral amplification multiplier, SDB reduces the baseline violation probability itself.
7.1 Mechanism of Single-Train Benefit
During single-train events, SDB improves crossing safety through four pathways:
- Directional awareness: The SDB indicates train approach direction, providing information not available from standard flashers. This additional channel reduces ambiguity about hazard location and timing.
- Early hazard salience: The progressive stage display (Caution → Danger → Blocked) introduces visual novelty that counteracts habituation to standard warning devices, particularly for frequent crossers.
- Late-entry violation reduction: The stage-based escalation provides a clear "do not proceed" signal that arrives before the train is visible, addressing the late-entry failure mode where users attempt to cross after seeing the train at distance.
- Signalized crosswalk misinterpretation mitigation: At crossings with adjacent pedestrian signals, SDB provides an independent hazard indicator that is not linked to the traffic signal cycle (see Section 8).
7.2 Modeled Effect on Baseline Violation
7.3 Illustrative Calculation — Pedestrian Single-Train
Penc,SDB = 0.002 + 0.998 × 0.0225 = 0.002 + 0.02246 = 0.02446 → R = 0.97555
Relative reduction = (0.03194 − 0.02446) / 0.03194 = 23.4%
Section 08
Signalized and Multi-Condition Pedestrian Reliability Expansion
This section extends the quantified reliability model defined in Section 5 to pedestrian failure modes at signalized rail crossings. The baseline encounter model is:
Where Psys is the probability the warning system is not usable, and Puser is the probability the pedestrian violates during active warning. Baseline parameters for this section:
| Parameter | Symbol | Value |
|---|---|---|
| System unavailability | Psys | 0.002 |
| Baseline single-train pedestrian violation | Puser,s | 0.03 |
Each subsection applies a condition-specific multiplier k to the baseline violation probability, yielding Puser = k × Puser,s. SDB impact is modeled as a reduction in the multiplier.
8.1 Signalized Preemption — Hazard Attribution Failure
Conceptual Correction
The earlier framing assumed the dominant failure was "pedestrian receives WALK while train approaches before preemption." In most modern preemption logic, the pedestrian WALK phase is terminated before train arrival. The actual dominant failure mode is different: the pedestrian observes a red or "Don't Walk" indication but sees no visible vehicle conflict. They violate because the reason for the red signal is not cognitively connected to a rail hazard. This is a hazard attribution failure, not a WALK-phase confusion failure.
Under rail preemption, the traffic signal controller extends red phases for the approaching train. A pedestrian arriving at the crossing observes a persistent red indication with no visible vehicle justification. The pedestrian decision model is vehicle-centered: compliance with red is calibrated to perceived vehicle conflict, not rail conflict.
With SDB reducing the multiplier by providing train-specific hazard attribution:
Relative unsafe-entry reduction = (0.055892 − 0.037928) / 0.055892 = ≈32%
SDB addresses this failure mode by supplying the missing hazard attribution: the directional display communicates that a rail hazard — not merely a signal timing artifact — requires continued waiting.
8.2 ADA Late Entry Timing Vulnerability
Pedestrians with mobility impairments require longer crossing times. At rail crossings with dynamic preemption transitions, a mobility-impaired pedestrian may enter the crossing during a permissive phase but remain within the track zone when the rail preemption phase activates. This represents Puser enlargement driven by physical constraint and timing mismatch rather than cognitive failure.
With SDB reducing the multiplier through progressive hazard-state communication:
Relative unsafe-entry reduction = (0.067868 − 0.04691) / 0.067868 = ≈31%
8.3 Parallel Turn Conflict
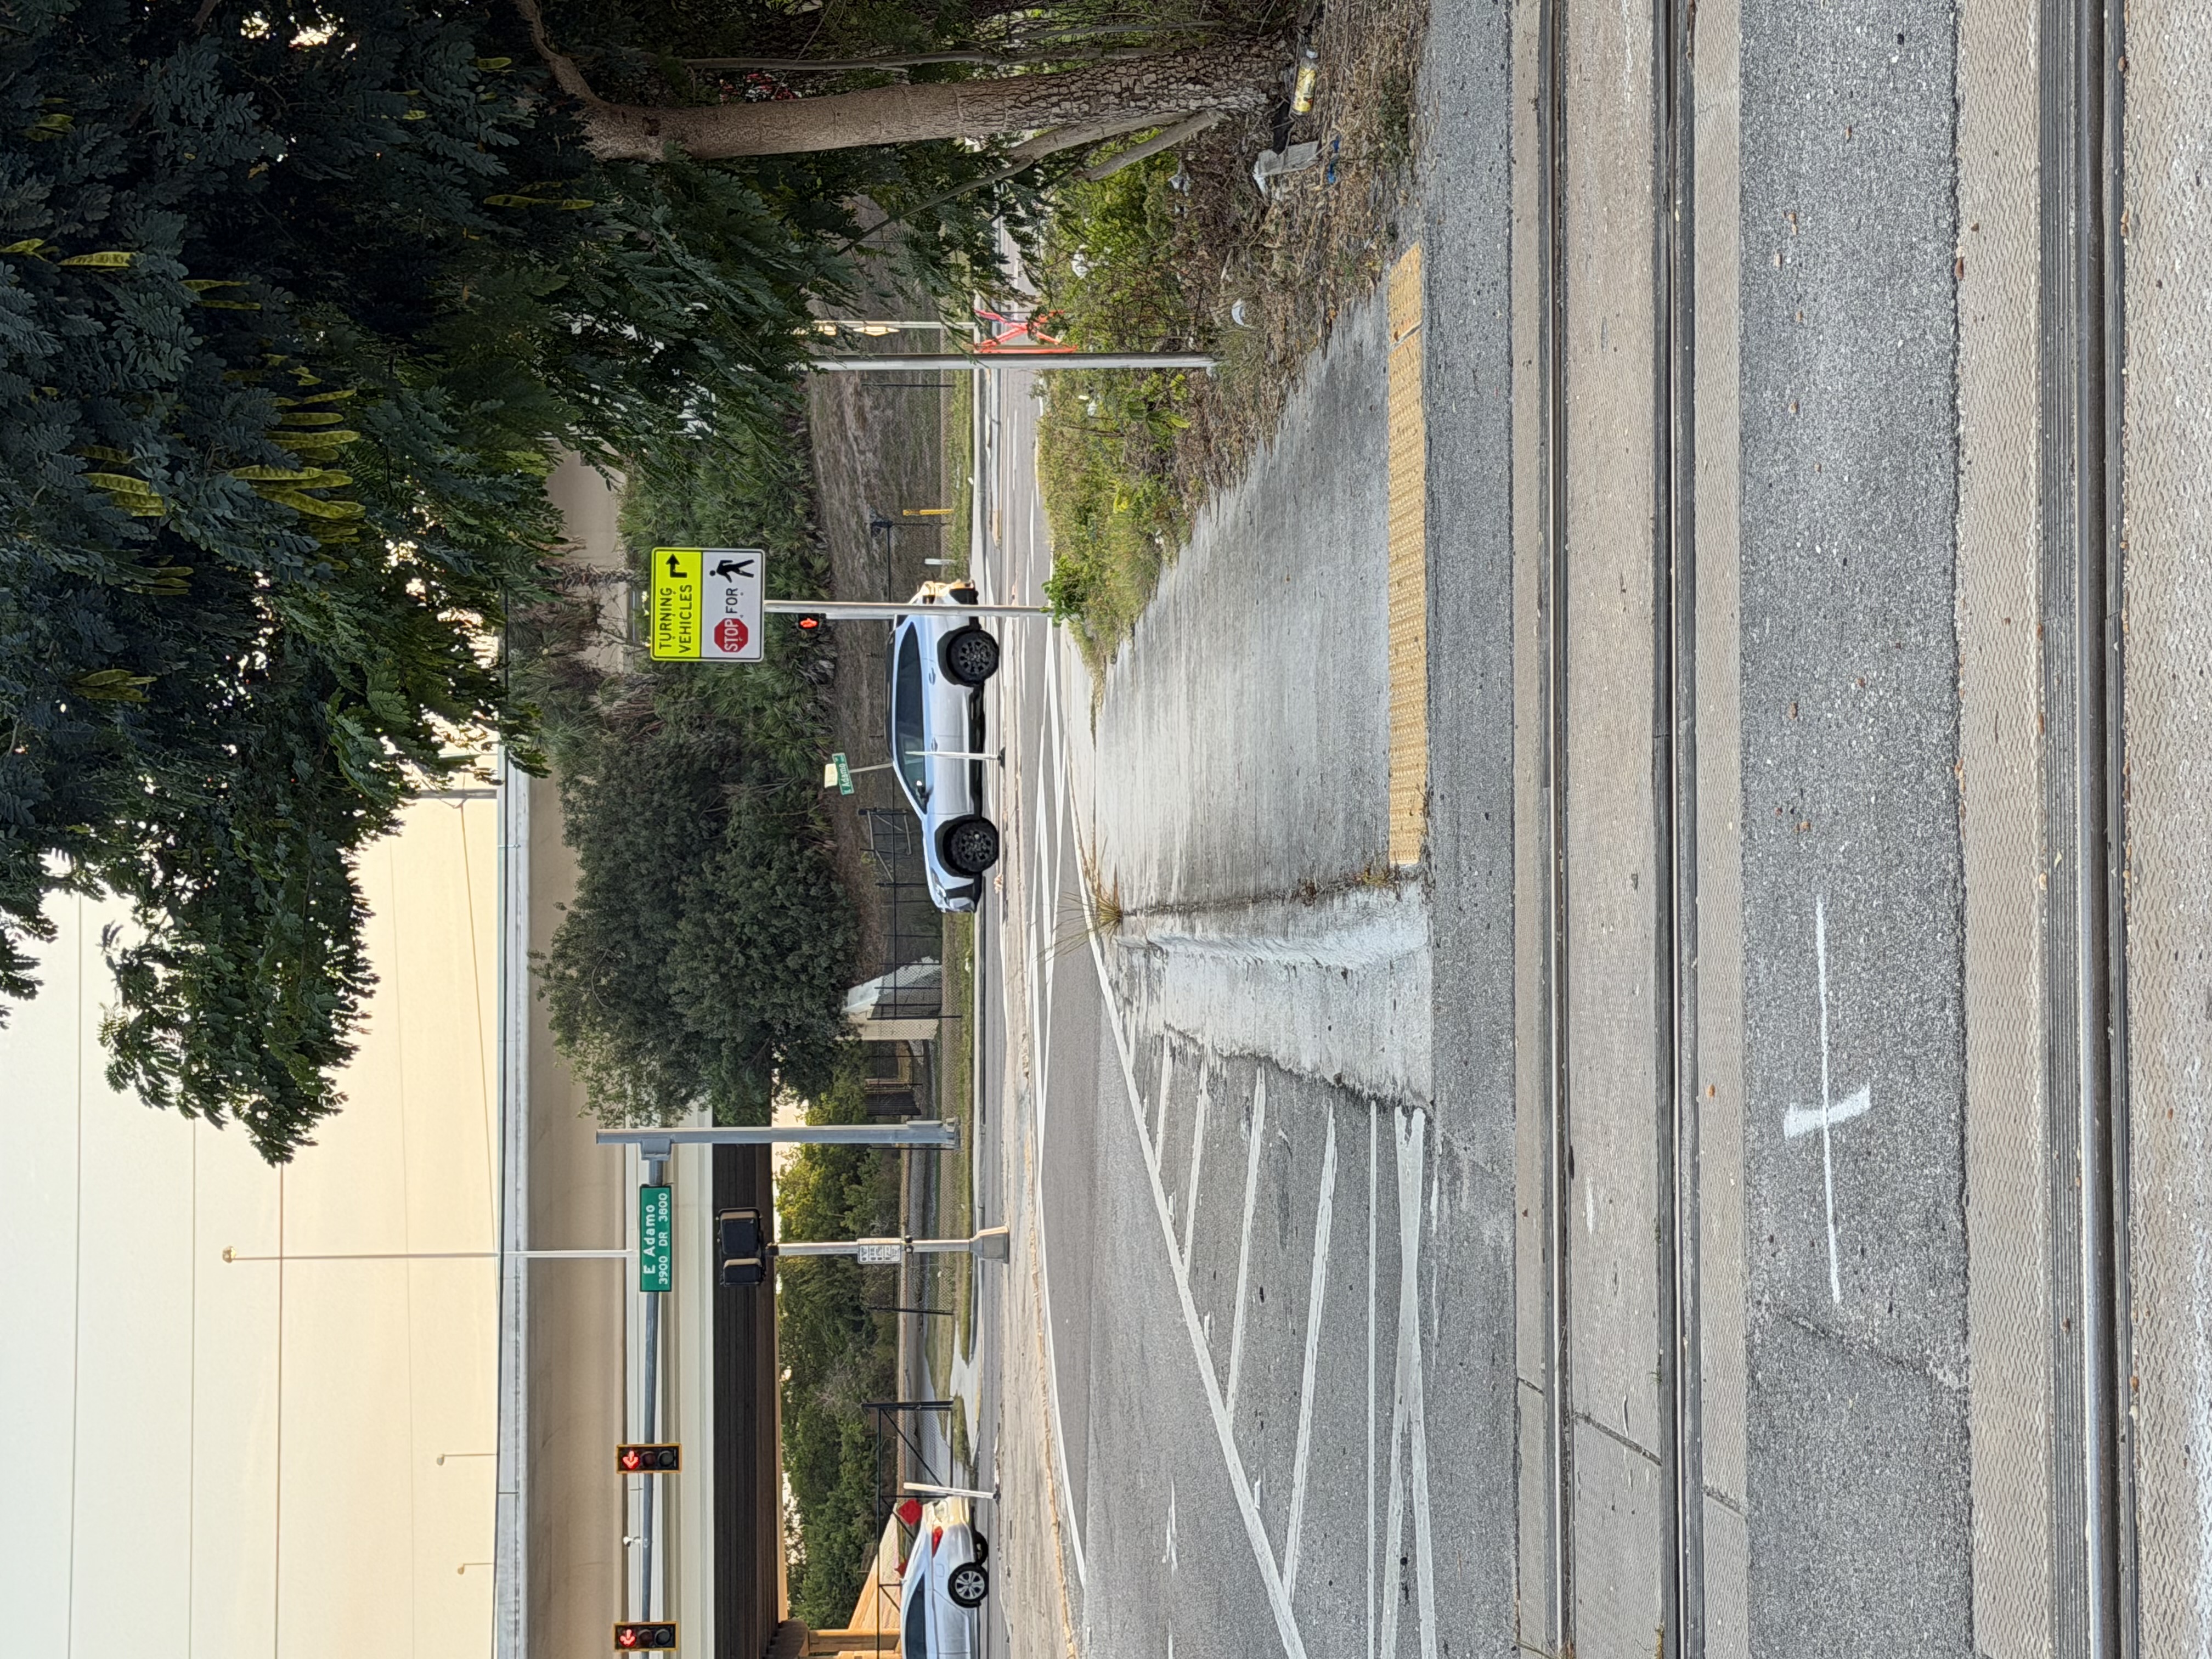
During the pedestrian WALK phase at signalized rail crossings, turning vehicles may move on paths conflicting with the pedestrian trajectory. When a vehicle turn conflict occurs simultaneously with an approaching rail hazard, the pedestrian's attention is divided.
Relative unsafe-entry reduction: ≈24%
8.4 Refuge Zone Misinterpretation (Multi-Track)
At multi-track rail crossings, pedestrians who are mid-crossing when the signal changes frequently use the center track zone as an informal refuge area, assuming temporary safety. The center zone may lie directly within the path of a second train approaching from the opposite direction.
Relative unsafe-entry reduction: ≈43%
8.5 Station-Induced Rushing
At rail crossings adjacent to center-line station platforms, pedestrians observe an arriving train at the platform and initiate a rush to board. The goal shifts from hazard avoidance to time optimization. Second-train awareness is particularly vulnerable.
Relative unsafe-entry reduction: ≈46%
8.6 Summary Table — Pedestrian Signalized Conditions
| Failure Mode | Baseline Reliability | With SDB | Absolute Gain | Relative Reduction |
|---|---|---|---|---|
| Preemption Attribution | 94.4% | 96.2% | +1.8% | 32% |
| ADA Timing | 93.2% | 95.3% | +2.1% | 31% |
| Turn Conflict | 95.0% | 96.2% | +1.2% | 24% |
| Refuge Zone | 92.3% | 95.6% | +3.3% | 43% |
| Station Rushing | 90.8% | 95.0% | +4.2% | 46% |
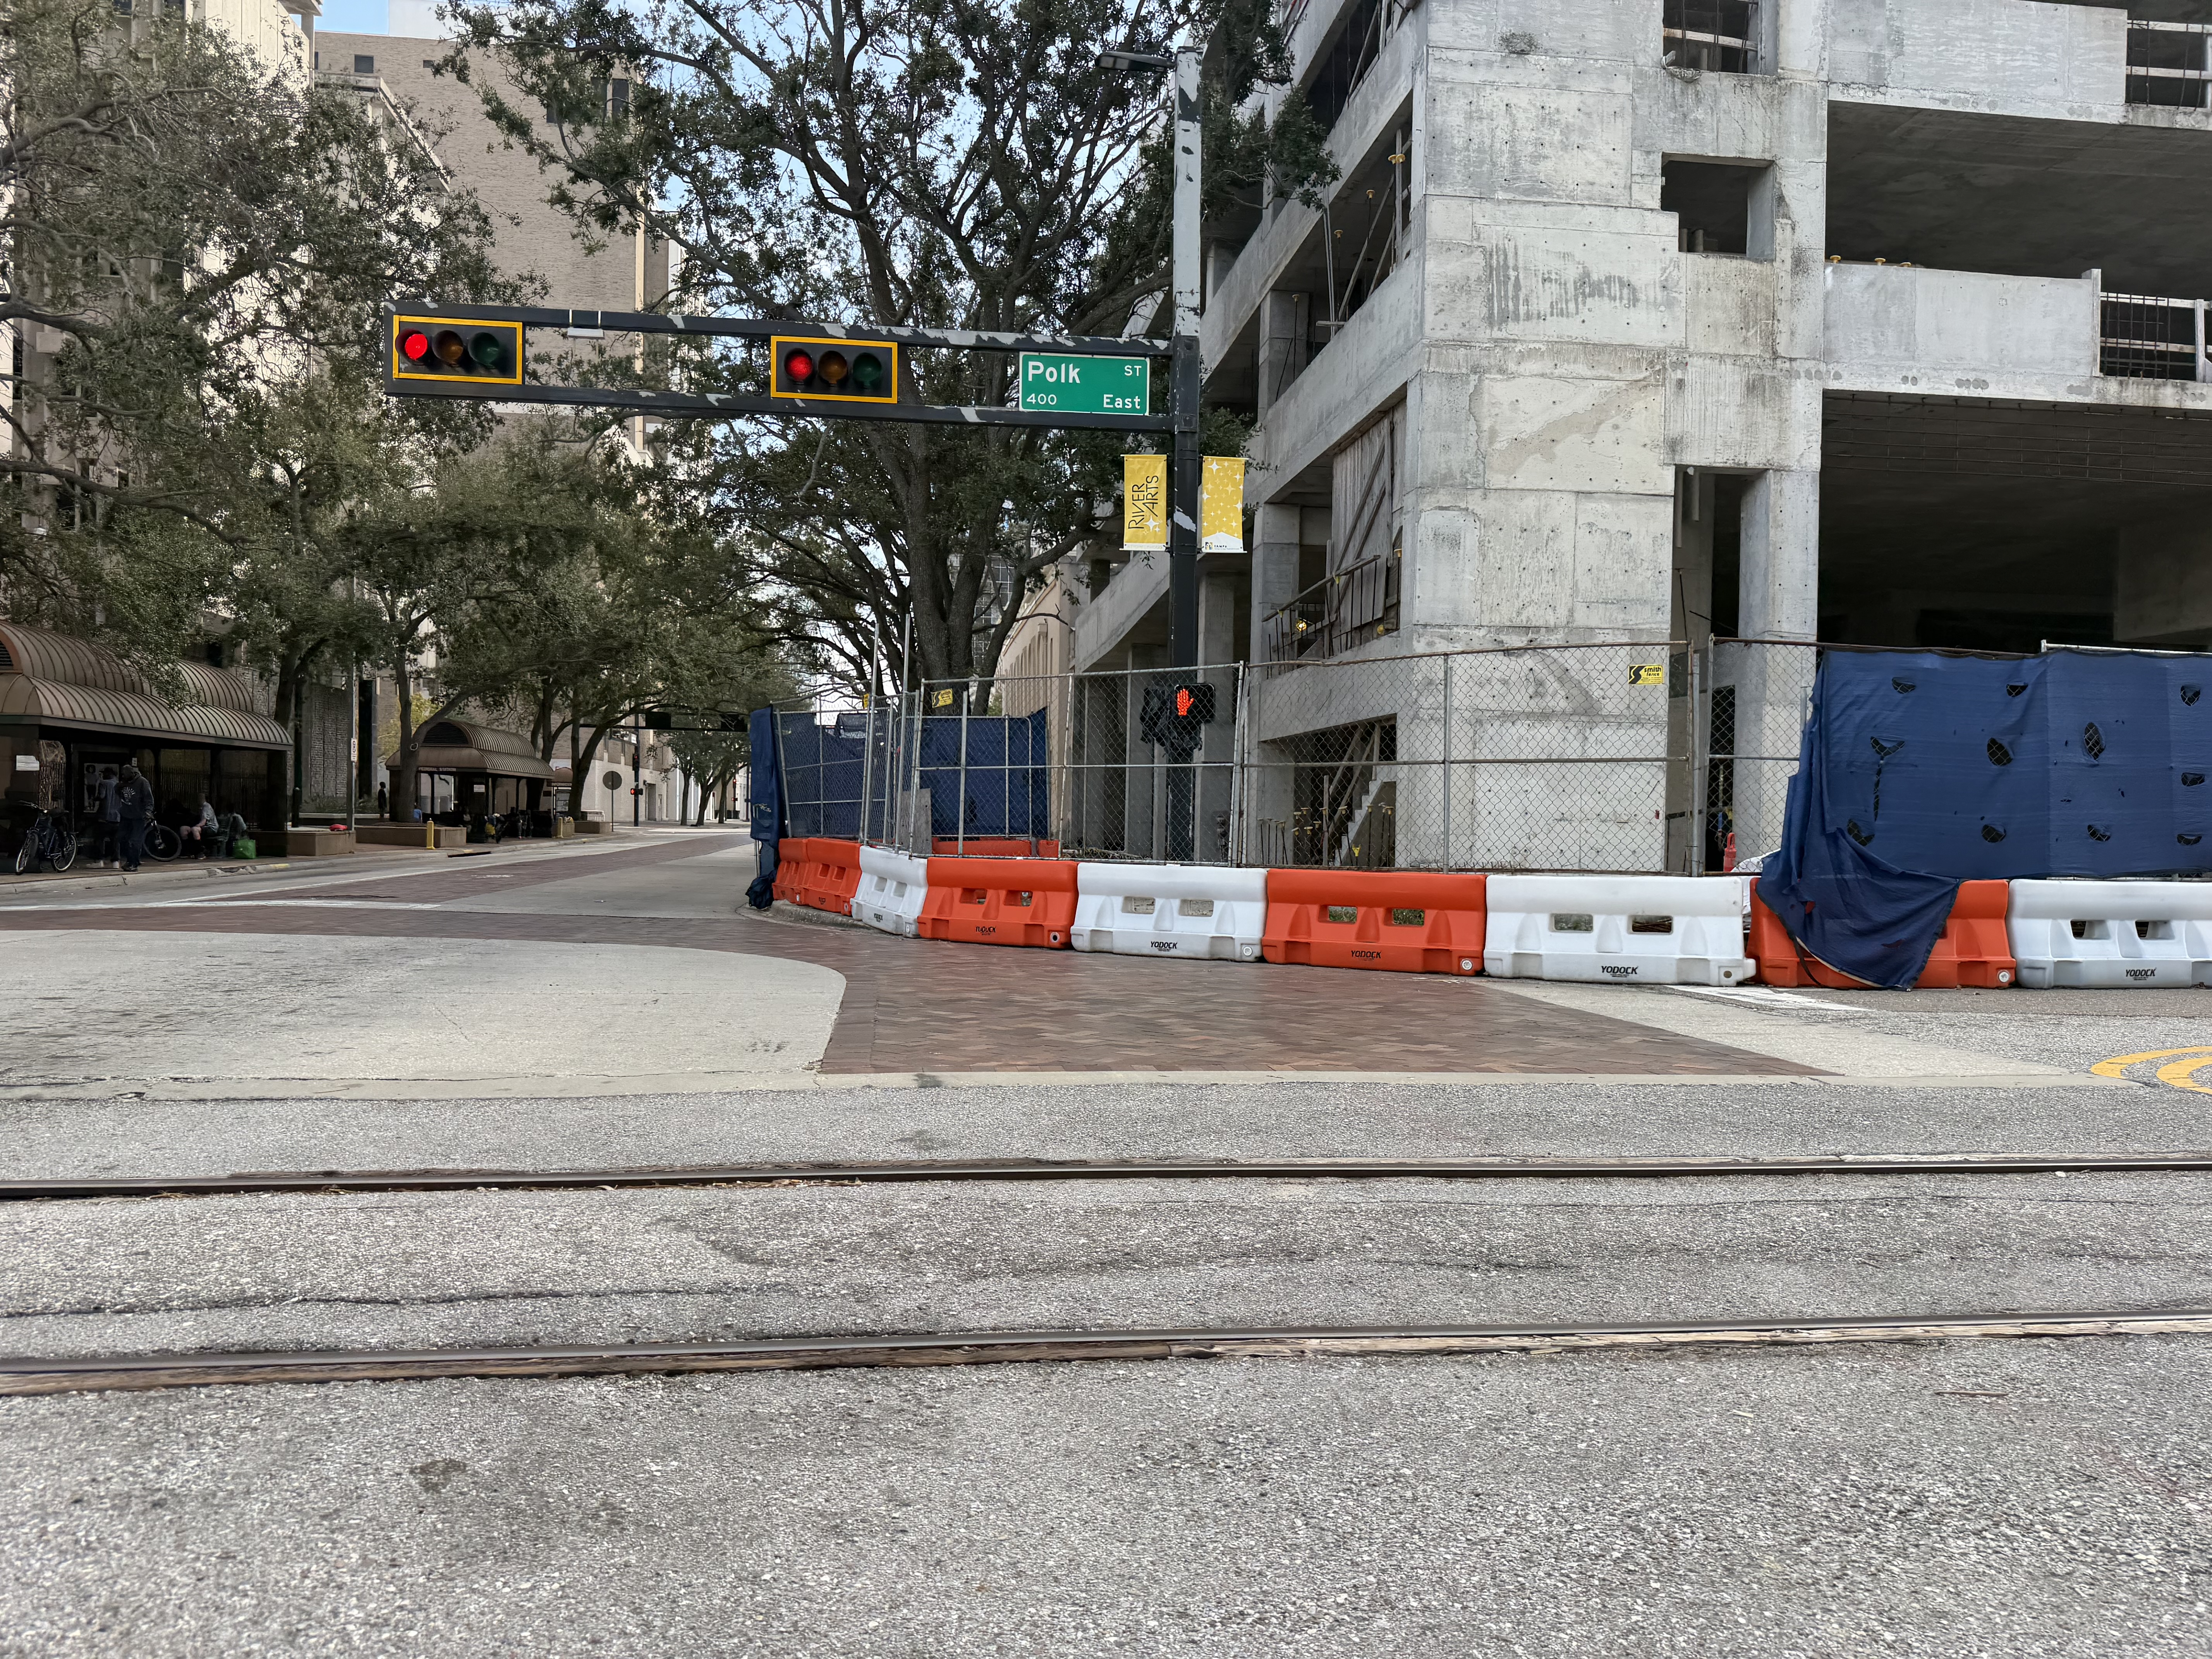
Signalized preemption environment — pedestrians may misattribute red signal to traffic timing rather than approaching train
Minimal-protection crossing — single defense layer configuration where SDB provides critical additional barrier
Section 09
SDB Mechanism: Multi-Stage Logic
9.1 Three-Stage Progressive Display: Caution → Danger → Blocked
The SDB employs a three-stage progressive display that maps to the evolving threat level. Each stage transition provides new information to the road user, counteracting the habituation and information stagnation that increase violation probability in traditional systems.
Figure 2 — SDB multi-stage progressive display logic. Each stage transition injects new information, counteracting cognitive habituation.
9.2 Functional Comparison: Traditional vs. SDB
| Characteristic | Traditional System | SDB System |
|---|---|---|
| Information content over time | Constant (no change after activation) | Progressive (stage transitions) |
| Directional awareness | None | Left/Right approach indication |
| Multi-train acknowledgment | Implicit only (continued activation) | Explicit "SECOND TRAIN" display |
| Habituation trajectory | Accelerating (identical stimulus) | Reset at each stage transition |
| Malfunction attribution risk | Elevated (no explanatory context) | Reduced (display explains continued activation) |
| User decision model | Must infer hazard from unchanging signal | Hazard state explicitly communicated |
9.3 Mapping to the Reliability Model
Within the quantified model (Section 5), SDB's multi-stage logic reduces the behavioral amplification multiplier m through three mechanisms:
- Stage transitions reset habituation — preventing the exponential growth of Puser with time during continued activation
- Directional information resolves ambiguity — reducing malfunction attribution and the associated Puser increase
- Explicit "SECOND TRAIN" display eliminates inference requirement — directly addressing the cognitive failure that drives mno SDB to the 3–5 range
The combined effect of these mechanisms is reflected in the reduced multiplier mSDB ≈ 1.3–1.8 used in Section 6.
Section 10
User Group Vulnerability and Gate Configuration Analysis
10.1 Pedestrian and Cyclist Susceptibility
Pedestrians and cyclists represent the most vulnerable user groups during double-train events due to a convergence of behavioral and physical factors:
| Vulnerability Factor | Pedestrians | Cyclists | Effect on Puser |
|---|---|---|---|
| Primary decision input | Visual — identical flashers provide no new signal | Visual — reduced by speed and wind | Increases baseline violation probability |
| Physical barrier effectiveness | No barrier in one-side gate configs | Can circumvent half-gate with minimal effort | Removes gate defense layer |
| Decision-to-crossing latency | Near-zero (immediate movement) | Near-zero (already in motion posture) | Reduces time for self-correction |
| Commitment reversibility | High (can stop easily) | Low (momentum + balance constraints) | Increases consequence of initial violation decision |
| Expectation violation sensitivity | High (attribute to malfunction) | Moderate-high (time pressure adds urgency) | Drives m toward upper range |
| Auditory input quality | Moderate (headphones, ambient noise) | Low (wind noise at speed) | Reduces effectiveness of bell defense layer |
10.2 One-Side Pedestrian Gate Configurations
At crossings with one-side (asymmetric) pedestrian gate configurations, the gate defense layer is effectively absent for pedestrians and cyclists approaching from the unprotected side. In the Swiss Cheese framework, this means the gate "slice" has a maximally large hole for these users, making the user compliance layer the final meaningful defense.
Configuration Relevance: Because one-side gate configurations eliminate the physical barrier for a significant fraction of pedestrian and cyclist traffic, the SDB's ability to maintain user compliance layer integrity during double-train events is disproportionately important at these locations. The SDB provides the functional equivalent of a compliance reinforcement mechanism where the gate layer is absent.
10.3 Risk-Phase-Specific Reinforcement
The SDB is a risk-phase-specific reinforcement mechanism: it concentrates its intervention at the precise temporal window when existing defenses are weakest, rather than providing uniform additional warning across all phases of crossing operation.
Figure 3 — Risk-phase targeting: SDB provides maximum intervention during the elevated-risk temporal window, when m is highest.
10.4 Vehicle Double-Train Scenario (Brief)
Vehicles benefit from the physical gate barrier, which substantially limits the gate defense layer failure probability. The vehicle case demonstrates the model's applicability across user types, though the absolute benefit is smaller.
Penc = 0.002 + 0.998 × 0.024 = 0.02595 → R = 0.97405
Penc,SDB = 0.002 + 0.998 × 0.012 = 0.01398 → R = 0.98602
The vehicle case confirms that SDB provides measurable benefit across user types, though the absolute magnitude is smaller due to the lower baseline violation probability afforded by physical gate barriers.
10.5 Pedestrian Double-Train Case (One-Side Gate)
For completeness, the pedestrian double-train case with one-side gate configuration:
(Higher mno SDB reflects absence of physical barrier on one side)
Penc = 0.002 + 0.998 × 0.12 = 0.12176 → R = 0.87824
Penc,SDB = 0.002 + 0.998 × 0.045 = 0.04691 → R = 0.95309
Observation
The pedestrian one-side gate scenario yields the largest absolute reliability gain (+7.5 percentage points) among all cases, consistent with the analysis that SDB's value is highest where the gate defense layer is absent and user compliance is the final defense.
Road-level crossing envelope — track zone with pavement markings indicating refuge zone boundaries
Center zone often used as informal pedestrian refuge, creating spatial misperception failure mode
Section 11
Comparative Swiss Cheese Visualization
Side-by-side comparison of defense layer configuration during a double-train event. Hole sizes are qualitative representations of the failure probabilities defined in the reliability model (Section 5).
Figure 4 — Comparative Swiss Cheese Model during double-train scenario. Left: traditional system with elevated behavioral failure probability. Right: SDB system maintaining reduced failure probability through information injection and stage-based display.
Section 12
Summary of Quantified Results
The following table consolidates all scenario calculations. Absolute reliability gain is the arithmetic difference in R (probability units). Relative unsafe-entry reduction is the fractional decrease in Penc (dimensionless ratio). These metrics are mathematically distinct and must not be interchanged.
| Scenario | Baseline R (without SDB) | R with SDB | Absolute Gain (RSDB − Rbase) | Relative Reduction (ΔPenc / Penc,base) |
|---|---|---|---|---|
| Pedestrian — Double Train (one-side gate, mno=4, mSDB=1.5) | 0.8782 | 0.9531 | +0.0749 | 61.5% |
| Cyclist — Double Train (primary case, mno=3, mSDB=1.4) | 0.8932 | 0.9491 | +0.0559 | 52.4% |
| Pedestrian — Single Train (k=0.75 baseline reduction) | 0.9681 | 0.9755 | +0.0075 | 23.4% |
| Vehicle — Double Train (secondary case, mno=3, mSDB=1.5) | 0.9740 | 0.9860 | +0.0120 | 46.1% |
| Signalized Pedestrian (Illustrative — Sections 8.1–8.5) | 90.8–95.0% | 95.0–96.2% | +1.2% to +4.2% | 24–46% |
Reading This Table
- Absolute Reliability Gain (column 4) measures the probability-unit improvement in safe crossing outcomes. Larger values indicate greater improvement for individual crossing encounters.
- Relative Unsafe-Entry Reduction (column 5) measures the fraction of previously-unsafe entries that SDB converts to compliant behavior.
- All values are illustrative and based on the parameter ranges defined in Section 5.4. Field validation is required.
Visual Comparison of Reliability Improvements
Section 13
Findings
Section 14
Defense Alignment Visualization
14.1 Horizontal Alignment View
The following diagram provides the standard horizontal Swiss Cheese representation showing how SDB disrupts hazard trajectory alignment during double-train events.
Figure 5 — Horizontal alignment view. Left: enlarged holes align during double-train event without SDB. Right: SDB layer disrupts alignment chain through both an additional defense slice and reduced adjacent-layer failure probabilities.
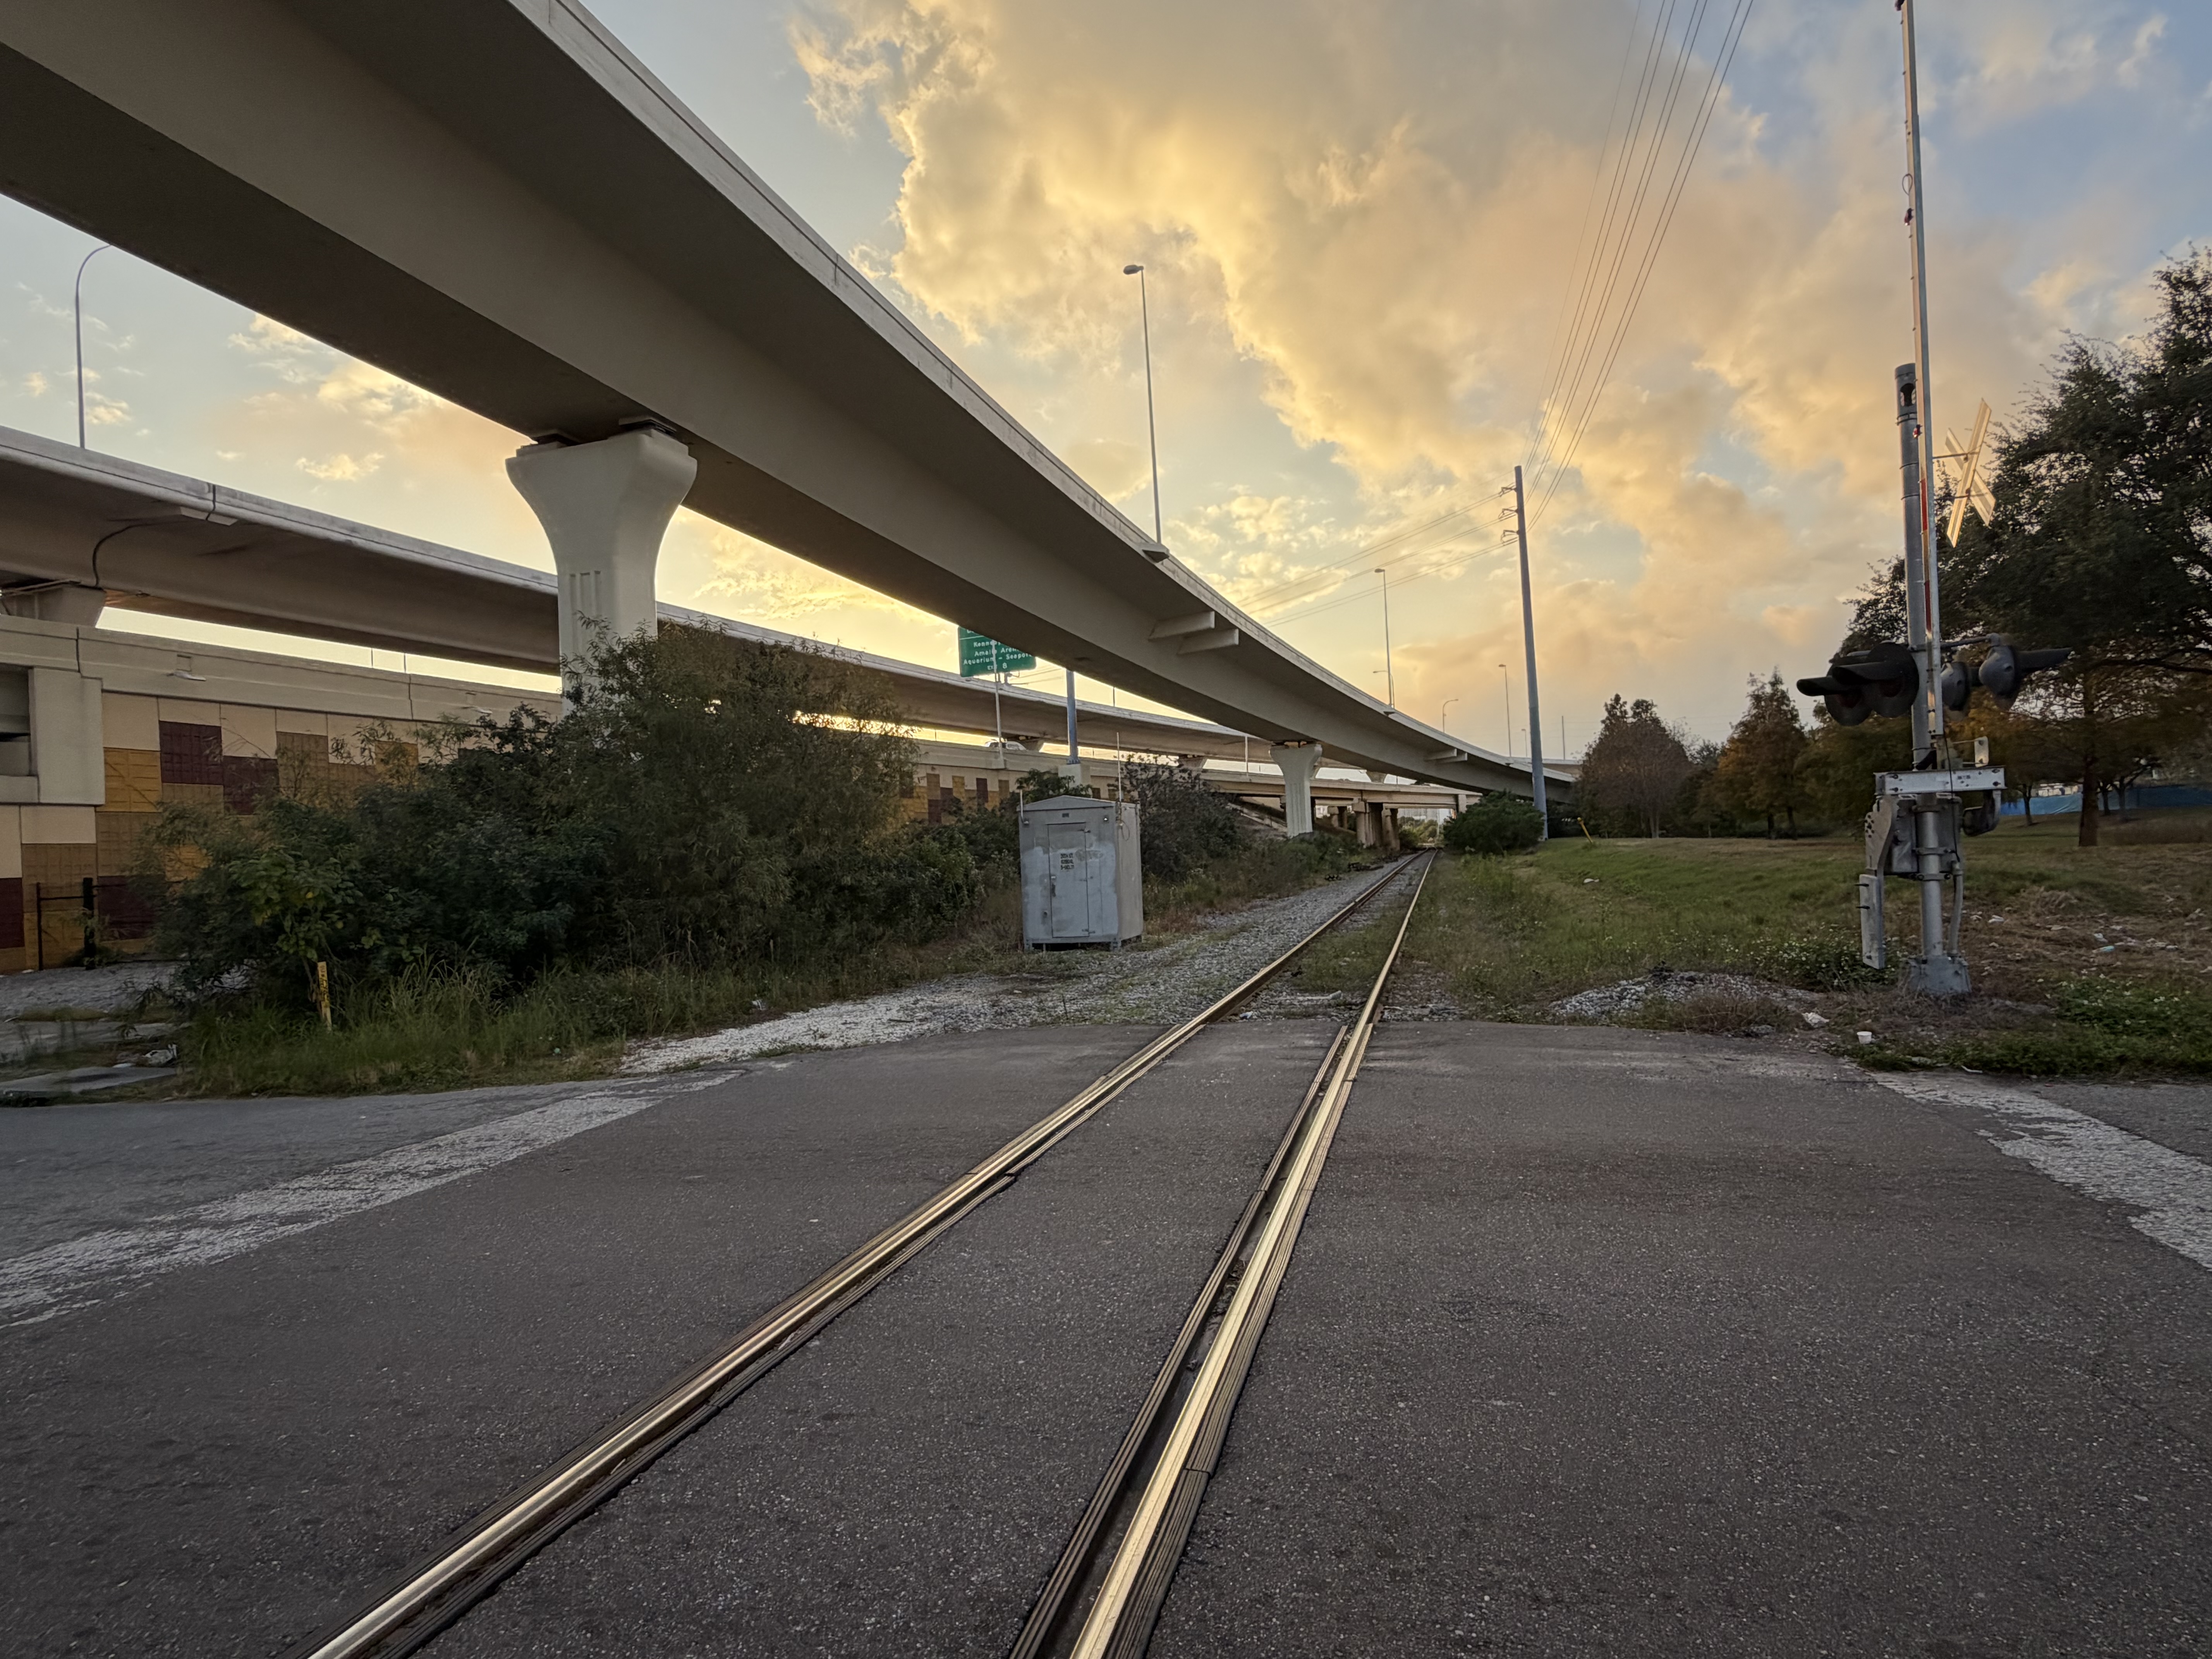
Track-level perspective — the crossing environment where safety barriers must perform reliably across all conditions
SDB addresses behavioral failure modes that traditional infrastructure alone cannot resolve
Section 15
Conclusion
This analysis demonstrates that the Safety Digital Box addresses a specific, documented, and high-consequence failure mode at grade crossings: the behavioral defense degradation that occurs when road users misinterpret continued warning activation during multi-train events. The formal reliability model quantifies the SDB's contribution in terms of both absolute reliability gain and relative unsafe-entry reduction, two distinct metrics that together characterize the intervention's effectiveness.
Three properties of the SDB intervention emerge from the analysis:
- Temporal Precision: SDB's progressive display logic (Caution → Danger → Blocked) activates its most distinctive capabilities during the elevated-risk window between first-train clearance and second-train arrival — the precise interval when traditional systems provide no new information and Puser is subject to behavioral amplification.
- Behavioral Defense Reinforcement: SDB reduces the behavioral amplification multiplier (m) from the 3–5 range to approximately 1.3–1.8 by providing stage-transition information that counteracts expectation violation, habituation acceleration, and malfunction attribution. This effect propagates to adjacent defense layers by re-validating the continued relevance of flasher and bell activation.
- Vulnerable User Protection: The intervention yields its largest absolute reliability gains for pedestrians and cyclists in one-side gate configurations (up to +0.075), consistent with the structural analysis showing that user compliance is the final defense where physical barriers are absent.
Additional scope items — single-train baseline reduction, signalized crosswalk misinterpretation mitigation — extend the SDB benefit case beyond the double-train scenario, though these require field-calibrated parameters for formal safety case use.
In addition to reducing behavioral amplification (m), SDB also constitutes an independent defense layer, thereby contributing marginally to structural OSR.
— End of Document —
SDB Swiss Cheese Model Analysis — Version 2.0 — February 2026